## Scatter Plot: Correlation between Generation and Multiple Choice Scores
### Overview
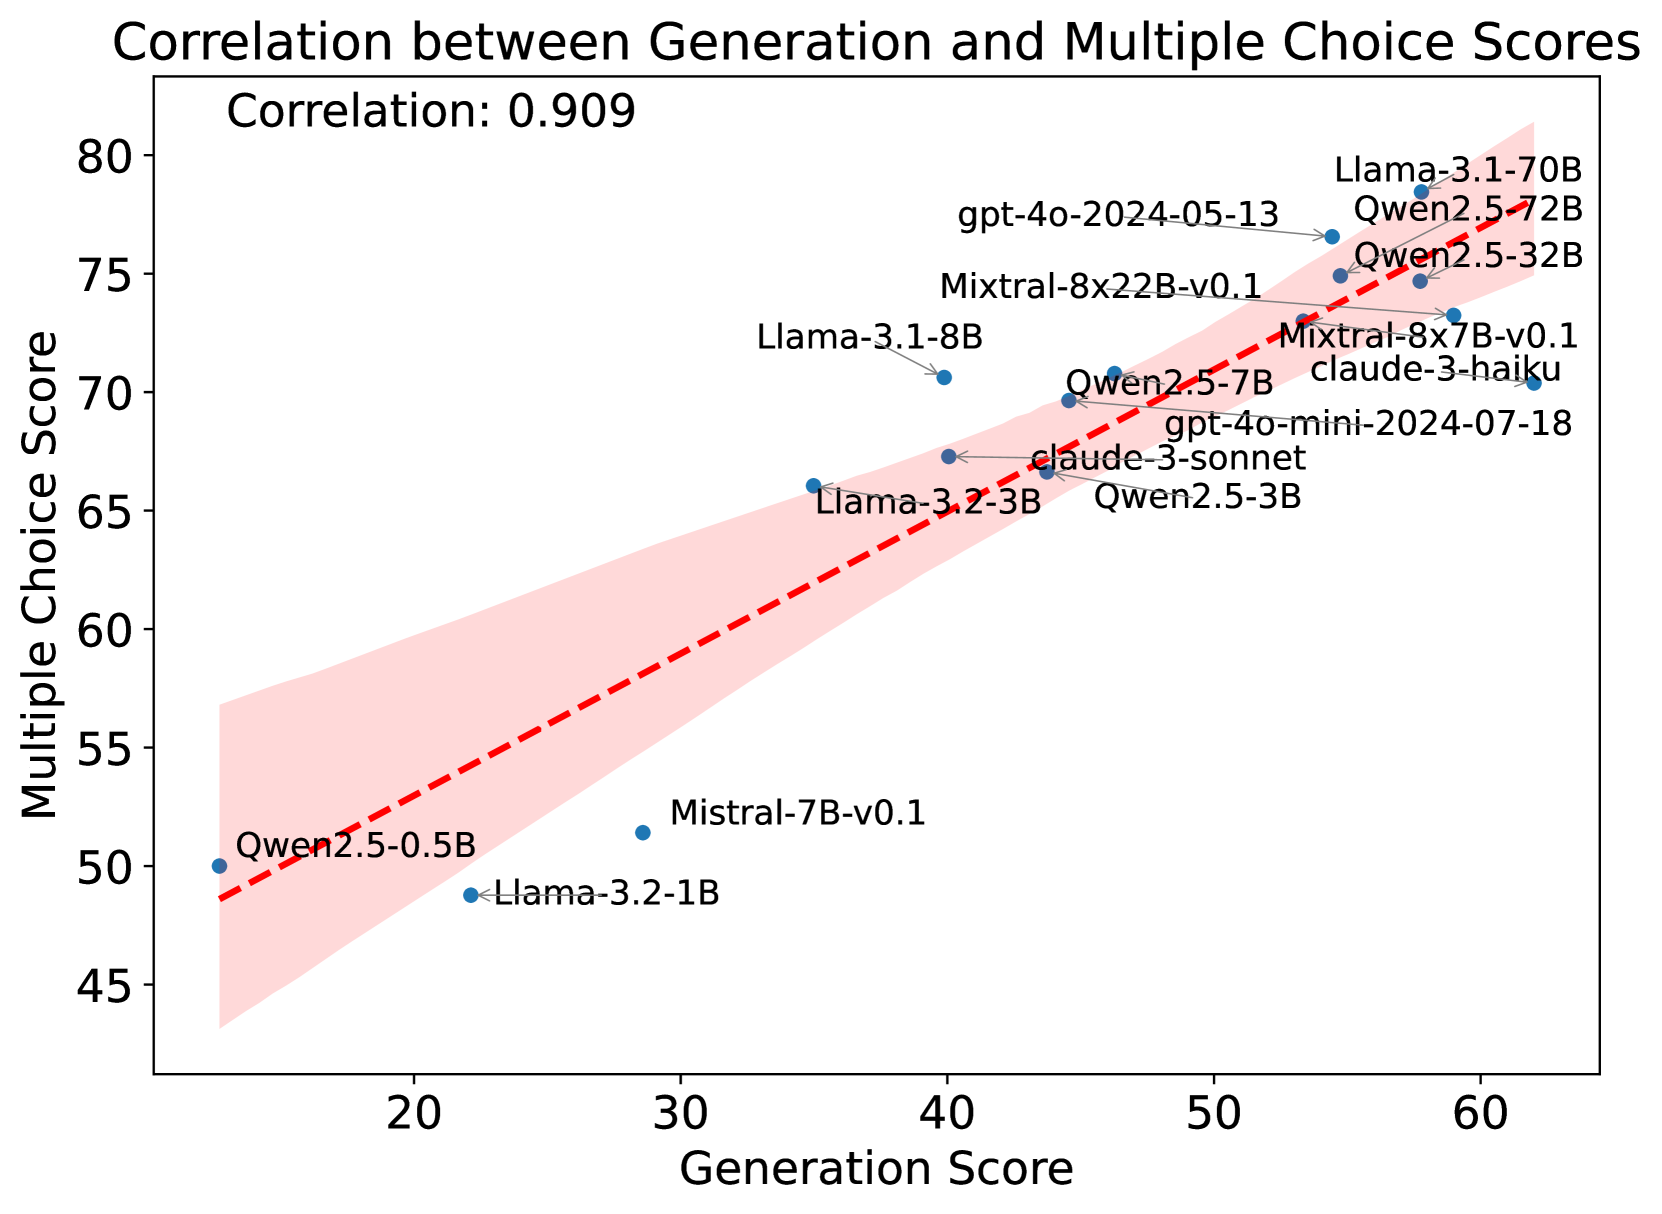
The image displays a scatter plot analyzing the relationship between "Generation Score" (x-axis) and "Multiple Choice Score" (y-axis). A strong positive correlation (r = 0.909) is indicated by a red dashed trend line and shaded confidence interval. Data points represent AI models with annotations for model names, versions, and parameter sizes.
### Components/Axes
- **X-axis**: Generation Score (20–60)
- **Y-axis**: Multiple Choice Score (45–80)
- **Legend**: Model names/versions (e.g., "gpt-4o-2024-05-13", "Mixtral-8x22B-v0.1")
- **Trend Line**: Red dashed line with shaded confidence interval (pink)
- **Data Points**: Blue dots with model-specific labels
### Detailed Analysis
1. **Trend Line**:
- Slope: Strong positive (r = 0.909)
- Equation: Approximate linear fit from (20, 50) to (60, 80)
- Confidence Interval: ±~5 points around the trend line
2. **Data Points**:
- **High-Scoring Models**:
- Llama-3.1-70B: (58, 78)
- Qwen2.5-72B: (55, 76)
- gpt-4o-2024-05-13: (50, 75)
- **Mid-Range Models**:
- Mixtral-8x22B-v0.1: (45, 70)
- Claude-3-haiku: (58, 70)
- **Lower-Scoring Models**:
- Qwen2.5-0.5B: (20, 50)
- Llama-3.2-1B: (25, 52)
3. **Parameter Size Correlation**:
- Larger models (e.g., 70B, 8x22B) cluster in the upper-right quadrant
- Smaller models (e.g., 0.5B, 1B) cluster in the lower-left quadrant
### Key Observations
- **Strong Correlation**: 0.909 indicates near-perfect linear relationship
- **Outliers**:
- Qwen2.5-0.5B deviates significantly below the trend line
- Claude-3-haiku shows lower performance than expected for its generation score
- **Model Size Pattern**: Larger parameter sizes generally correlate with higher scores
### Interpretation
The data demonstrates that AI model performance on multiple-choice tasks strongly correlates with generation capabilities. The trend line suggests that for every 1-point increase in generation score, multiple-choice scores increase by ~1.1 points (slope ≈ 1.1). The shaded confidence interval indicates high certainty in this relationship.
Notably, model parameter size appears to be a key differentiator, with larger models consistently outperforming smaller ones. However, exceptions like Qwen2.5-0.5B (low score despite moderate generation) suggest architectural efficiency may also play a role. The high correlation coefficient (0.909) implies that generation quality is a dominant factor in task performance, though not the sole determinant.