## Line Chart: Hyperparameter Study of the Coefficient of Causality Constraints
### Overview
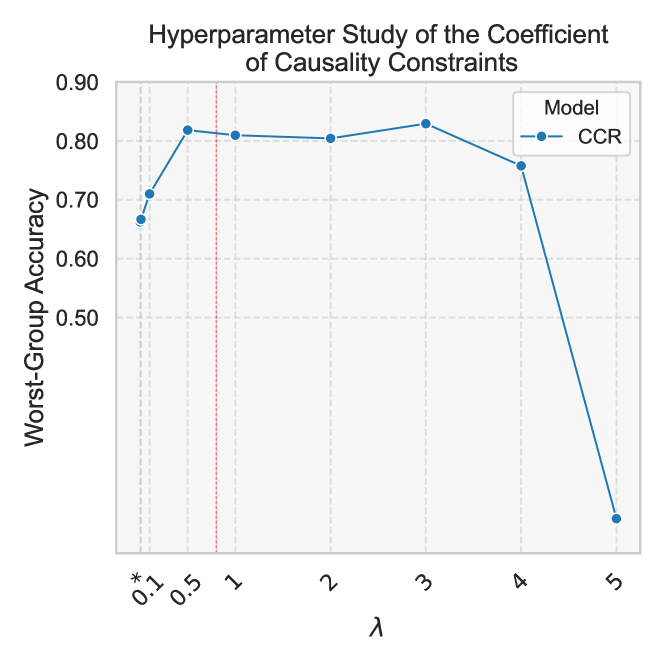
The image is a line chart showing the relationship between the hyperparameter λ (lambda) and the worst-group accuracy of a model called CCR (Causality Constraints Regularization). The chart explores how different values of λ affect the model's performance, specifically focusing on the worst-performing group.
### Components/Axes
* **Title:** Hyperparameter Study of the Coefficient of Causality Constraints
* **X-axis:** λ (lambda), with values 0.1*, 0.5, 1, 2, 3, 4, and 5. The 0.1 value has an asterisk.
* **Y-axis:** Worst-Group Accuracy, ranging from 0.50 to 0.90 in increments of 0.10.
* **Legend:** Located in the top-right corner, indicating that the blue line represents the "CCR" model.
* **Vertical Lines:** Dashed grey vertical lines are present at x = 0.1, 0.5, 2, 3, 4, and 5. A dashed red vertical line is present at x = 1.
### Detailed Analysis
* **CCR (Causality Constraints Regularization) Model:**
* The line starts at approximately (0.1, 0.67).
* The line increases to approximately (0.5, 0.82).
* The line decreases slightly to approximately (1, 0.81).
* The line remains relatively stable at approximately (2, 0.80).
* The line increases slightly to approximately (3, 0.83).
* The line decreases to approximately (4, 0.76).
* The line decreases sharply to approximately (5, 0.15).
### Key Observations
* The worst-group accuracy peaks around λ = 3, with a value of approximately 0.83.
* The accuracy drops significantly when λ = 5, indicating that higher values of λ negatively impact the model's performance on the worst-performing group.
* The performance is relatively stable between λ = 1 and λ = 3.
### Interpretation
The chart suggests that the hyperparameter λ has a significant impact on the worst-group accuracy of the CCR model. The optimal value of λ appears to be around 3, where the model achieves its highest accuracy on the worst-performing group. Increasing λ beyond this point leads to a sharp decline in accuracy, indicating that excessive regularization can be detrimental to the model's performance. The red vertical line at λ = 1 may indicate a baseline or default value for the hyperparameter, while the asterisk next to 0.1 may indicate a special case or a lower bound for the hyperparameter. The study demonstrates the importance of tuning hyperparameters to optimize model performance, particularly when considering fairness and the performance of underrepresented groups.