\n
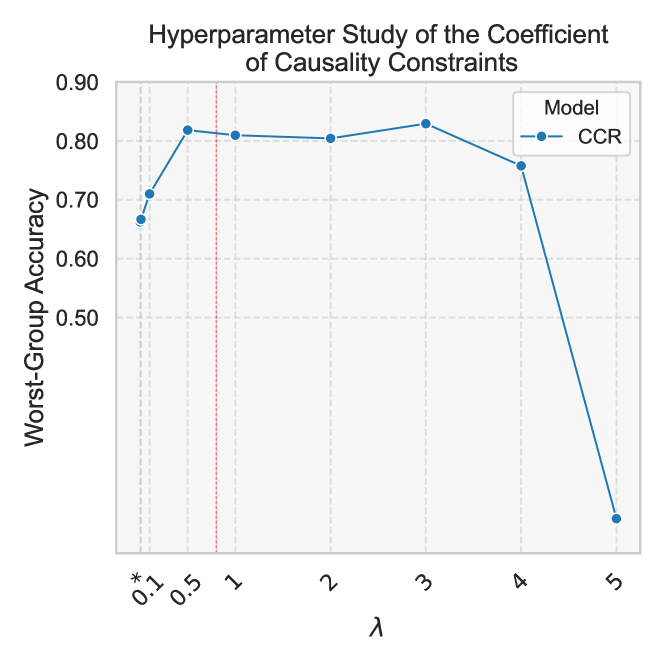
## Line Chart: Hyperparameter Study of the Coefficient of Causality Constraints
### Overview
This image presents a line chart illustrating the relationship between a hyperparameter (λ - lambda) and Worst-Group Accuracy. The chart appears to be evaluating the performance of a model (CCR) across a range of lambda values. A vertical dashed line at λ = 1 may indicate a significant threshold or point of interest.
### Components/Axes
* **Title:** "Hyperparameter Study of the Coefficient of Causality Constraints" (Top-center)
* **X-axis:** λ (lambda) - ranging from 0.1 to 5, with markers at 0.1, 0.5, 1, 2, 3, 4, and 5.
* **Y-axis:** Worst-Group Accuracy - ranging from 0.5 to 0.9, with markers at 0.5, 0.6, 0.7, 0.8, and 0.9.
* **Legend:** Located in the top-right corner.
* Model: CCR (represented by a blue dashed line with circular markers)
* **Vertical Dashed Line:** Located at λ = 1.
### Detailed Analysis
The chart displays a single data series representing the CCR model. The line begins at approximately 0.68 accuracy at λ = 0.1.
* **λ = 0.1:** Accuracy ≈ 0.68 (± 0.02)
* **λ = 0.5:** Accuracy ≈ 0.81 (± 0.02)
* **λ = 1:** Accuracy ≈ 0.82 (± 0.02) - This is the peak accuracy.
* **λ = 2:** Accuracy ≈ 0.81 (± 0.02)
* **λ = 3:** Accuracy ≈ 0.81 (± 0.02)
* **λ = 4:** Accuracy ≈ 0.74 (± 0.02)
* **λ = 5:** Accuracy ≈ 0.45 (± 0.02) - A significant drop in accuracy.
The line initially increases rapidly from λ = 0.1 to λ = 0.5, then plateaus between λ = 0.5 and λ = 3, and finally declines sharply from λ = 4 to λ = 5.
### Key Observations
* The model performs best around λ = 1, achieving a peak accuracy of approximately 0.82.
* Accuracy decreases significantly as λ exceeds 4.
* The vertical dashed line at λ = 1 may indicate an optimal hyperparameter value.
* The initial increase in accuracy suggests that increasing lambda up to a certain point improves performance.
* The subsequent decrease suggests that excessively high lambda values may lead to overfitting or other issues.
### Interpretation
The data suggests that the coefficient of causality constraints (λ) has a significant impact on the Worst-Group Accuracy of the CCR model. There appears to be an optimal value for λ, around 1, where the model achieves its highest performance. Beyond this point, increasing λ leads to a decline in accuracy, potentially due to overfitting or the introduction of excessive constraints. The initial increase in accuracy indicates that incorporating causality constraints up to a certain level is beneficial. The sharp drop at λ = 5 suggests that the model becomes unstable or loses its ability to generalize when the constraints are too strong. This study highlights the importance of hyperparameter tuning in machine learning and the need to find a balance between model complexity and generalization ability. The vertical line at λ = 1 could be a suggested default value for this hyperparameter.