## Line Chart: Hyperparameter Study of the Coefficient of Causality Constraints
### Overview
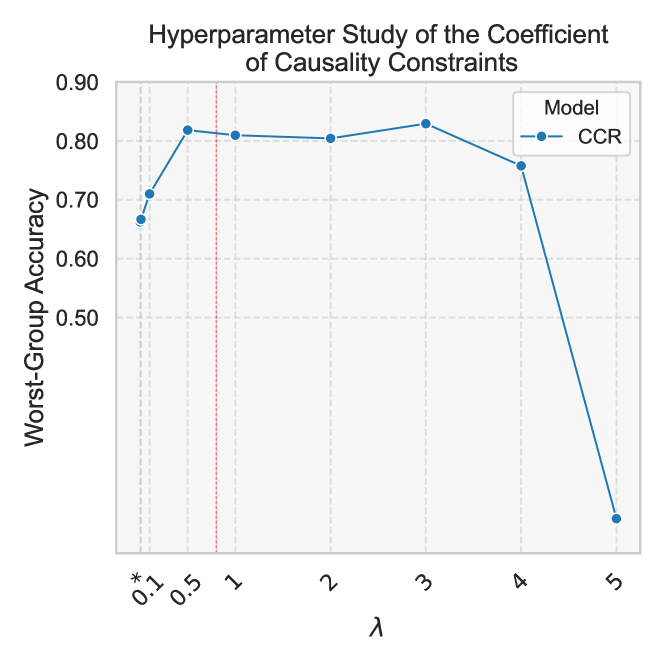
The image is a line chart titled "Hyperparameter Study of the Coefficient of Causality Constraints." It plots the performance of a model, labeled "CCR," as a function of a hyperparameter λ (lambda). The chart shows how the model's "Worst-Group Accuracy" changes across different values of λ, with a notable peak and a subsequent sharp decline.
### Components/Axes
* **Title:** "Hyperparameter Study of the Coefficient of Causality Constraints" (Top-center).
* **Y-Axis:**
* **Label:** "Worst-Group Accuracy" (Left side, vertical).
* **Scale:** Linear scale ranging from approximately 0.50 to 0.90. Major gridlines are present at 0.50, 0.60, 0.70, 0.80, and 0.90.
* **X-Axis:**
* **Label:** "λ" (Bottom-center).
* **Scale:** Categorical or non-linear scale with the following labeled tick marks: `0.1*`, `0.5`, `1`, `2`, `3`, `4`, `5`. The asterisk on `0.1*` may indicate a special note or baseline value.
* **Legend:**
* **Location:** Top-right corner, inside the plot area.
* **Title:** "Model".
* **Entry:** A blue line with a circular marker labeled "CCR".
* **Additional Element:** A vertical red dashed line is positioned at the x-axis value of `0.5`.
### Detailed Analysis
The chart displays a single data series for the "CCR" model. The trend is as follows:
1. **Initial Rise:** Starting at λ = `0.1*`, the Worst-Group Accuracy is approximately **0.67**. It rises sharply to about **0.71** at the next data point (between 0.1 and 0.5), then peaks at approximately **0.82** at λ = `0.5`.
2. **Plateau:** From λ = `0.5` to λ = `3`, the accuracy remains relatively stable and high, fluctuating slightly around **0.81-0.83**. The points are at approximately:
* λ = `1`: ~0.81
* λ = `2`: ~0.81
* λ = `3`: ~0.83 (the apparent maximum)
3. **Sharp Decline:** After λ = `3`, the accuracy begins to drop. At λ = `4`, it falls to approximately **0.76**. The decline becomes precipitous, plummeting to approximately **0.42** at λ = `5`.
**Spatial Grounding & Verification:** The blue line with circular markers corresponds exactly to the "CCR" model in the legend. The red dashed line is an annotation not included in the legend, placed precisely at the x-axis tick `0.5`, which coincides with the first peak in accuracy.
### Key Observations
* **Optimal Range:** The model's worst-group performance is optimal and stable for λ values between approximately 0.5 and 3.
* **Performance Cliff:** There is a severe performance degradation when λ is increased beyond 3, with accuracy dropping by over 40 percentage points between λ=3 and λ=5.
* **Annotation Significance:** The red dashed line at λ=0.5 highlights a critical threshold, likely indicating a default, recommended, or baseline value for the hyperparameter where good performance is first achieved.
* **Non-Monotonic Behavior:** The relationship is not linear or monotonic; increasing the constraint coefficient (λ) first helps, then has little effect, and finally severely harms performance on the worst-performing group.
### Interpretation
This chart demonstrates the sensitivity of a causality-constrained model (CCR) to its regularization hyperparameter λ. The data suggests:
1. **The "Goldilocks" Principle for Constraints:** Applying some causality constraint (λ > 0) is crucial, as seen by the jump from λ=0.1* to λ=0.5. However, the constraint must be carefully tuned. A moderate constraint (λ between 0.5 and 3) yields robust worst-group performance, implying the model learns generalizable, causal features without being overly restricted.
2. **Over-Constraining is Detrimental:** The catastrophic drop at λ=5 indicates that excessively strong causality constraints likely prevent the model from learning any useful patterns, crippling its ability to perform even on the worst group. This could be due to the constraints becoming too rigid, conflicting with the data, or causing optimization difficulties.
3. **Practical Implication:** For deployment or further experimentation, λ should be set within the stable plateau region (e.g., λ=1 or λ=2) to ensure reliable worst-group accuracy. The value λ=0.5, marked by the red line, may represent a sweet spot that balances performance and constraint strength. The study underscores the importance of hyperparameter validation, as the optimal value is not at the extreme end of the tested range.