## Line Chart: Hyperparameter Study of the Coefficient of Causality Constraints
### Overview
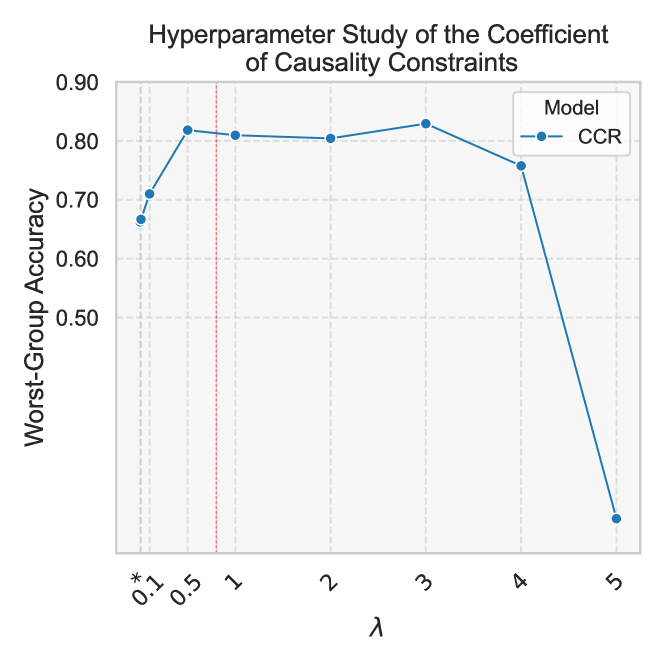
The chart illustrates the relationship between the hyperparameter λ (lambda) and worst-group accuracy for a model labeled "CCR." The x-axis represents λ values ranging from 0.1 to 5, while the y-axis measures worst-group accuracy from 0.5 to 0.9. A vertical red dashed line marks λ = 0.5, and the blue line with circular markers shows the model's performance across λ values.
### Components/Axes
- **Title**: "Hyperparameter Study of the Coefficient of Causality Constraints"
- **X-axis**:
- Label: λ (lambda)
- Scale: 0.1, 0.5, 1, 2, 3, 4, 5 (with vertical gridlines at each marker)
- Notable feature: Red dashed vertical line at λ = 0.5
- **Y-axis**:
- Label: Worst-Group Accuracy
- Scale: 0.5, 0.6, 0.7, 0.8, 0.9
- **Legend**:
- Position: Top-right corner
- Content: "Model: CCR" (blue line with circular markers)
- **Data Series**:
- Blue line with circular markers (CCR model)
### Detailed Analysis
- **Data Points**:
- λ = 0.1: Accuracy ≈ 0.67
- λ = 0.5: Accuracy ≈ 0.82
- λ = 1: Accuracy ≈ 0.82
- λ = 2: Accuracy ≈ 0.81
- λ = 3: Accuracy ≈ 0.83
- λ = 4: Accuracy ≈ 0.75
- λ = 5: Accuracy ≈ 0.4
- **Trends**:
- The accuracy increases sharply from λ = 0.1 (0.67) to λ = 0.5 (0.82).
- From λ = 0.5 to λ = 3, accuracy remains relatively stable (0.81–0.83).
- A steep decline occurs between λ = 3 (0.83) and λ = 5 (0.4).
### Key Observations
1. **Peak Performance**: The highest accuracy (0.83) occurs at λ = 3.
2. **Threshold Effect**: The red dashed line at λ = 0.5 coincides with a critical performance increase (0.82), suggesting a potential optimal range near this value.
3. **Sharp Decline**: At λ = 5, accuracy drops to 0.4, indicating severe performance degradation at extreme λ values.
4. **Stability**: The model maintains consistent accuracy (0.81–0.83) between λ = 1 and λ = 3.
### Interpretation
The chart demonstrates that the CCR model's worst-group accuracy is highly sensitive to λ. Optimal performance is observed in the range λ = 0.5–3, with λ = 3 yielding the highest accuracy. The abrupt drop at λ = 5 suggests overfitting, instability, or a breakdown of causality constraints at extreme values. The red dashed line at λ = 0.5 may represent a theoretical or practical threshold where performance begins to plateau or stabilize. This study highlights the importance of tuning λ within the 0.5–3 range to balance accuracy and model robustness.