## Line Chart: CIFAR-100 Test Accuracy vs. d1
### Overview
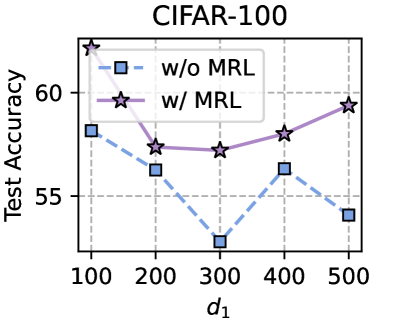
The image is a line chart comparing the test accuracy of a model on the CIFAR-100 dataset with and without MRL (presumably a regularization method) across different values of a parameter 'd1'. The chart displays two lines, one representing the model without MRL (dashed blue line with square markers) and the other representing the model with MRL (solid purple line with star markers). The x-axis represents the values of 'd1', and the y-axis represents the test accuracy.
### Components/Axes
* **Title:** CIFAR-100
* **X-axis:**
* Label: d1
* Scale: 100, 200, 300, 400, 500
* **Y-axis:**
* Label: Test Accuracy
* Scale: 55, 60
* **Legend:** Located at the top-right of the chart.
* "w/o MRL": Dashed blue line with square markers.
* "w/ MRL": Solid purple line with star markers.
* Gridlines: Vertical and horizontal dashed grey lines.
### Detailed Analysis
**Data Series 1: w/o MRL (Dashed Blue Line with Square Markers)**
* Trend: The line initially decreases, then increases, and finally decreases again.
* Data Points:
* d1 = 100, Test Accuracy ≈ 57%
* d1 = 200, Test Accuracy ≈ 56%
* d1 = 300, Test Accuracy ≈ 52%
* d1 = 400, Test Accuracy ≈ 57%
* d1 = 500, Test Accuracy ≈ 54%
**Data Series 2: w/ MRL (Solid Purple Line with Star Markers)**
* Trend: The line initially decreases slightly, then remains relatively stable, and finally increases.
* Data Points:
* d1 = 100, Test Accuracy ≈ 60%
* d1 = 200, Test Accuracy ≈ 59%
* d1 = 300, Test Accuracy ≈ 58%
* d1 = 400, Test Accuracy ≈ 58%
* d1 = 500, Test Accuracy ≈ 59%
### Key Observations
* The model with MRL generally outperforms the model without MRL across all values of 'd1'.
* The model without MRL shows more fluctuation in test accuracy as 'd1' changes.
* The model with MRL shows a more stable test accuracy across different values of 'd1'.
### Interpretation
The chart suggests that using MRL (presumably a regularization method) improves the test accuracy and stability of the model on the CIFAR-100 dataset. The model without MRL is more sensitive to changes in the parameter 'd1', resulting in greater fluctuations in test accuracy. The MRL method likely helps to generalize better across different values of 'd1'. The optimal value of d1 appears to be 100 for the model without MRL, and 500 for the model with MRL.