## Line Chart: Answer Accuracy vs. Layer for Llama Models
### Overview
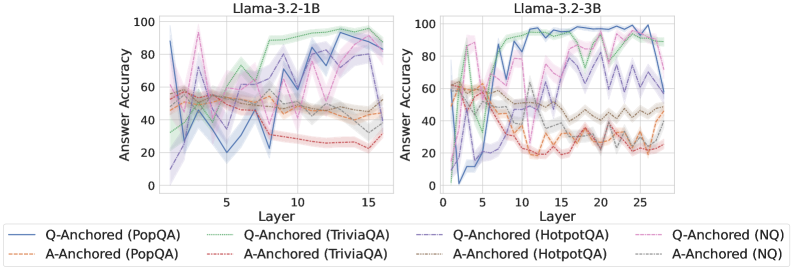
The image presents two line charts comparing the answer accuracy of different question-answering datasets (PopQA, TriviaQA, HotpotQA, and NQ) across layers in two Llama models: Llama-3.2-1B and Llama-3.2-3B. The charts display accuracy as a function of layer number, with separate lines for question-anchored (Q-Anchored) and answer-anchored (A-Anchored) approaches within each dataset.
### Components/Axes
* **X-axis:** Layer (ranging from approximately 0 to 15 for the 1B model and 0 to 25 for the 3B model).
* **Y-axis:** Answer Accuracy (ranging from 0 to 100).
* **Left Chart Title:** Llama-3.2-1B
* **Right Chart Title:** Llama-3.2-3B
* **Legend:**
* Blue Line: Q-Anchored (PopQA)
* Orange Line: A-Anchored (PopQA)
* Green Line: Q-Anchored (TriviaQA)
* Purple Line: A-Anchored (TriviaQA)
* Brown Dashed Line: Q-Anchored (HotpotQA)
* Red Dashed Line: A-Anchored (HotpotQA)
* Light Blue Line: Q-Anchored (NQ)
* Light Orange Line: A-Anchored (NQ)
### Detailed Analysis or Content Details
**Llama-3.2-1B Chart:**
* **Q-Anchored (PopQA) - Blue Line:** Starts at approximately 60, dips to around 20 at layer 3, then fluctuates between 40 and 80, ending around 70 at layer 15.
* **A-Anchored (PopQA) - Orange Line:** Starts at approximately 55, decreases to around 30 at layer 3, remains relatively stable between 30 and 50, and ends around 40 at layer 15.
* **Q-Anchored (TriviaQA) - Green Line:** Starts at approximately 70, fluctuates between 60 and 90, and ends around 80 at layer 15.
* **A-Anchored (TriviaQA) - Purple Line:** Starts at approximately 60, dips to around 30 at layer 3, then rises to around 70, and ends around 60 at layer 15.
* **Q-Anchored (HotpotQA) - Brown Dashed Line:** Starts at approximately 50, fluctuates between 40 and 70, and ends around 60 at layer 15.
* **A-Anchored (HotpotQA) - Red Dashed Line:** Starts at approximately 40, fluctuates between 20 and 50, and ends around 30 at layer 15.
* **Q-Anchored (NQ) - Light Blue Line:** Starts at approximately 40, fluctuates between 20 and 60, and ends around 50 at layer 15.
* **A-Anchored (NQ) - Light Orange Line:** Starts at approximately 30, fluctuates between 10 and 40, and ends around 30 at layer 15.
**Llama-3.2-3B Chart:**
* **Q-Anchored (PopQA) - Blue Line:** Starts at approximately 60, dips to around 20 at layer 3, rises to around 90 at layer 10, and ends around 70 at layer 25.
* **A-Anchored (PopQA) - Orange Line:** Starts at approximately 55, decreases to around 30 at layer 3, remains relatively stable between 30 and 50, and ends around 40 at layer 25.
* **Q-Anchored (TriviaQA) - Green Line:** Starts at approximately 70, fluctuates between 60 and 90, and ends around 80 at layer 25.
* **A-Anchored (TriviaQA) - Purple Line:** Starts at approximately 60, dips to around 30 at layer 3, then rises to around 70, and ends around 60 at layer 25.
* **Q-Anchored (HotpotQA) - Brown Dashed Line:** Starts at approximately 50, fluctuates between 40 and 70, and ends around 60 at layer 25.
* **A-Anchored (HotpotQA) - Red Dashed Line:** Starts at approximately 40, fluctuates between 20 and 50, and ends around 30 at layer 25.
* **Q-Anchored (NQ) - Light Blue Line:** Starts at approximately 40, fluctuates between 20 and 60, and ends around 50 at layer 25.
* **A-Anchored (NQ) - Light Orange Line:** Starts at approximately 30, fluctuates between 10 and 40, and ends around 30 at layer 25.
### Key Observations
* In both models, Q-Anchored (PopQA) generally exhibits higher accuracy than A-Anchored (PopQA).
* TriviaQA consistently shows high accuracy for both Q-Anchored and A-Anchored approaches.
* HotpotQA and NQ generally have lower accuracy compared to PopQA and TriviaQA.
* The 3B model shows a more pronounced accuracy increase around layer 10 for PopQA (Q-Anchored) compared to the 1B model.
* The A-Anchored lines are generally lower in accuracy than the Q-Anchored lines across all datasets.
### Interpretation
The charts demonstrate the performance of Llama models across different question-answering datasets and anchoring strategies as the model depth (layers) increases. The higher accuracy observed with Q-Anchored approaches suggests that leveraging question information is more effective than answer information for these tasks. The differences in accuracy between datasets highlight the varying difficulty of the questions within each dataset. The 3B model's improved performance around layer 10 for PopQA suggests that increasing model size can lead to better performance, particularly at certain depths. The fluctuations in accuracy across layers indicate that the model's performance is not consistently improving with depth, and there may be optimal layer configurations for specific datasets and anchoring strategies. The consistent lower performance of HotpotQA and NQ suggests these datasets pose greater challenges for the models, potentially due to their complexity or the nature of the questions. These results are valuable for understanding the strengths and weaknesses of the Llama models and for guiding future research on improving question-answering performance.