## Line Charts: Llama-3.2 Model Answer Accuracy by Layer
### Overview
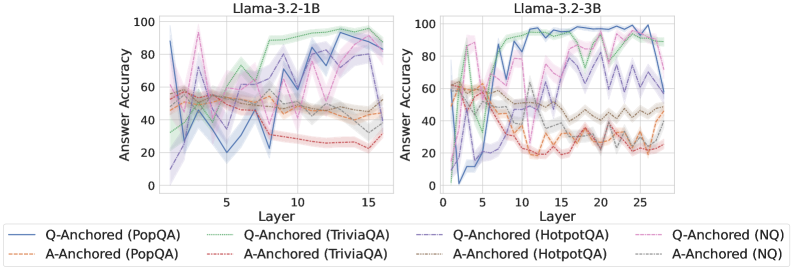
The image displays two side-by-side line charts comparing the "Answer Accuracy" of two language models, Llama-3.2-1B (left) and Llama-3.2-3B (right), across their internal layers. Each chart plots the performance of eight different evaluation series, which are combinations of two anchoring methods (Q-Anchored and A-Anchored) applied to four question-answering datasets (PopQA, TriviaQA, HotpotQA, NQ).
### Components/Axes
* **Chart Titles:** "Llama-3.2-1B" (left chart), "Llama-3.2-3B" (right chart).
* **X-Axis (Both Charts):** Labeled "Layer". The 1B model chart shows layers from approximately 0 to 16. The 3B model chart shows layers from approximately 0 to 28.
* **Y-Axis (Both Charts):** Labeled "Answer Accuracy". The scale runs from 0 to 100 in increments of 20.
* **Legend (Bottom of Image):** Contains eight entries, each defining a line's color, style, and the series it represents.
* **Solid Blue Line:** Q-Anchored (PopQA)
* **Dashed Orange Line:** A-Anchored (PopQA)
* **Solid Green Line:** Q-Anchored (TriviaQA)
* **Dashed Red Line:** A-Anchored (TriviaQA)
* **Solid Purple Line:** Q-Anchored (HotpotQA)
* **Dashed Brown Line:** A-Anchored (HotpotQA)
* **Solid Pink Line:** Q-Anchored (NQ)
* **Dashed Gray Line:** A-Anchored (NQ)
### Detailed Analysis
**Llama-3.2-1B Chart (Left):**
* **General Trend:** Accuracy for most series fluctuates significantly across layers, with a general upward trend for Q-Anchored methods and a flat or slightly downward trend for A-Anchored methods.
* **Q-Anchored Series (Solid Lines):**
* **PopQA (Blue):** Starts near 90% at layer 0, drops sharply to ~20% by layer 5, then recovers with high volatility, ending near 90% at layer 16.
* **TriviaQA (Green):** Starts around 40%, shows a steady, volatile climb to peak near 100% around layer 13, ending slightly lower.
* **HotpotQA (Purple):** Starts low (~10%), climbs erratically to a peak of ~80% around layer 12, then declines.
* **NQ (Pink):** Starts around 60%, shows high volatility with a peak near 95% at layer 3, then fluctuates between 40-80%.
* **A-Anchored Series (Dashed Lines):**
* All four A-Anchored series (PopQA-Orange, TriviaQA-Red, HotpotQA-Brown, NQ-Gray) cluster in a band between approximately 20% and 60% accuracy. They show less dramatic climbs than their Q-Anchored counterparts and often trend slightly downward in later layers.
**Llama-3.2-3B Chart (Right):**
* **General Trend:** The separation between Q-Anchored and A-Anchored performance is more pronounced. Q-Anchored methods show stronger, more sustained improvement with layer depth.
* **Q-Anchored Series (Solid Lines):**
* **PopQA (Blue):** Starts near 0%, climbs steeply to ~95% by layer 10, and maintains high accuracy (80-100%) through layer 28.
* **TriviaQA (Green):** Starts around 60%, climbs to near 100% by layer 10 and remains very high.
* **HotpotQA (Purple):** Starts low (~10%), climbs to a plateau of ~80% between layers 10-20, then becomes more volatile.
* **NQ (Pink):** Starts around 60%, shows high early volatility, then stabilizes in the 60-80% range.
* **A-Anchored Series (Dashed Lines):**
* Similar to the 1B model, these series (Orange, Red, Brown, Gray) are clustered in the lower half of the chart (mostly 20-60%). They show an initial rise but then plateau or decline, with TriviaQA (Red) and PopQA (Orange) trending lowest in later layers.
### Key Observations
1. **Model Scale Effect:** The larger 3B model demonstrates a clearer and more sustained improvement in accuracy for Q-Anchored methods as layers deepen, compared to the more volatile 1B model.
2. **Anchoring Method Dominance:** Across both models and all datasets, **Q-Anchored methods (solid lines) consistently achieve higher peak and final-layer accuracy than A-Anchored methods (dashed lines)**. This is the most salient pattern.
3. **Dataset Variability:** Performance varies by dataset. For Q-Anchored methods, TriviaQA (Green) and PopQA (Blue) often reach the highest accuracies, while HotpotQA (Purple) tends to be lower.
4. **Layer-wise Behavior:** Accuracy is not monotonic. Most series show significant layer-to-layer volatility, suggesting internal representations are being dynamically refined. Performance often peaks in the middle-to-late layers (e.g., layers 10-15 for 1B, layers 10-20 for 3B) before sometimes declining.
### Interpretation
This data suggests a fundamental difference in how information is utilized within the transformer layers of these models depending on the anchoring strategy. **Q-Anchored methods, which likely condition the model on the question, appear to enable the progressive building of more accurate internal representations as information flows through the network layers.** This effect is amplified with model scale (3B vs. 1B).
Conversely, **A-Anchored methods, which may condition on the answer or a different context, fail to leverage the depth of the network for accuracy gains.** Their performance stagnates or degrades, indicating that the model's intermediate layers are not being effectively optimized for the task under this paradigm.
The volatility across layers is a key finding, indicating that "deeper is not always linearly better." The model's internal processing involves complex transformations where accuracy can dip before rising, highlighting the non-linear nature of feature extraction and reasoning within the network. The charts provide empirical evidence for the importance of both **anchoring strategy** and **model scale** in determining how a large language model's performance evolves across its layers.