## Line Graph: Answer Accuracy Across Layers for Llama-3.2 Models
### Overview
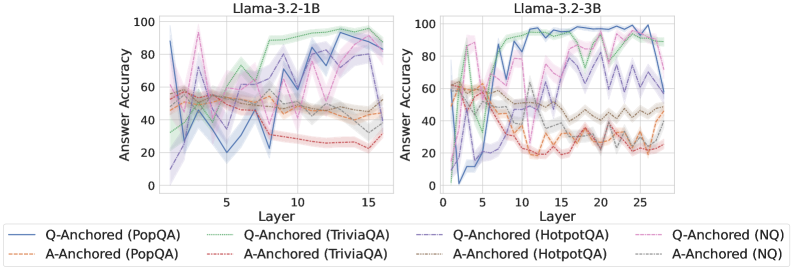
The image contains two side-by-side line graphs comparing answer accuracy across transformer model layers for two Llama-3.2 variants (1B and 3B parameters). Each graph shows multiple data series representing different question-answering datasets (PopQA, TriviaQA, HotpotQA) and anchoring methods (Q-Anchored vs A-Anchored). The graphs use color-coded lines with shaded confidence intervals to visualize performance trends.
### Components/Axes
- **X-axis (Layer)**:
- Left chart: 0–15 (Llama-3.2-1B)
- Right chart: 0–25 (Llama-3.2-3B)
- **Y-axis (Answer Accuracy)**: 0–100% (both charts)
- **Legends**:
- Positioned at bottom of each chart
- Line styles/colors:
- Solid blue: Q-Anchored (PopQA)
- Dashed green: Q-Anchored (TriviaQA)
- Dotted orange: Q-Anchored (HotpotQA)
- Solid red: A-Anchored (PopQA)
- Dashed gray: A-Anchored (TriviaQA)
- Dotted purple: A-Anchored (HotpotQA)
- Dashed black: Q-Anchored (NoQA)
- Dotted gray: A-Anchored (NoQA)
### Detailed Analysis
#### Llama-3.2-1B (Left Chart)
- **Q-Anchored (PopQA)**: Blue line shows peak accuracy ~85% at layer 10, with sharp drops at layers 5 and 15. Confidence interval (shaded blue) widens significantly at layer 15.
- **A-Anchored (PopQA)**: Orange dashed line remains stable at ~50–60% accuracy, with minimal fluctuations.
- **Q-Anchored (TriviaQA)**: Green dashed line peaks at ~70% at layer 8, then declines sharply to ~30% by layer 15.
- **A-Anchored (TriviaQA)**: Gray dashed line shows gradual decline from ~60% to ~40% across layers.
- **Q-Anchored (HotpotQA)**: Dotted orange line peaks at ~75% at layer 12, with erratic fluctuations.
- **A-Anchored (HotpotQA)**: Dotted purple line shows moderate performance (~50–60%) with a notable dip at layer 10.
- **NoQA Baselines**:
- Q-Anchored (NoQA): Black dashed line hovers ~40–50%.
- A-Anchored (NoQA): Gray dotted line remains flat at ~30%.
#### Llama-3.2-3B (Right Chart)
- **Q-Anchored (PopQA)**: Blue line maintains ~80–90% accuracy across layers 0–25, with a sharp drop to ~60% at layer 20.
- **A-Anchored (PopQA)**: Orange dashed line shows gradual decline from ~65% to ~40%.
- **Q-Anchored (TriviaQA)**: Green dashed line peaks at ~75% at layer 10, then declines to ~50% by layer 25.
- **A-Anchored (TriviaQA)**: Gray dashed line remains stable at ~50–60%.
- **Q-Anchored (HotpotQA)**: Dotted orange line peaks at ~80% at layer 15, with significant volatility.
- **A-Anchored (HotpotQA)**: Dotted purple line shows erratic performance (~40–70%) with a sharp drop at layer 20.
- **NoQA Baselines**:
- Q-Anchored (NoQA): Black dashed line hovers ~50–60%.
- A-Anchored (NoQA): Gray dotted line remains flat at ~35%.
### Key Observations
1. **Model Size Impact**: Llama-3.2-3B generally shows higher baseline accuracy than Llama-3.2-1B, particularly in Q-Anchored configurations.
2. **Dataset Sensitivity**:
- PopQA performs best with Q-Anchored methods in both models.
- HotpotQA shows the most volatility, especially in the 3B model.
3. **Layer Dependency**:
- Accuracy peaks cluster around layers 8–15 for 1B and 10–15 for 3B.
- Performance declines sharply after layer 15 in the 3B model.
4. **Anchoring Method**: Q-Anchored consistently outperforms A-Anchored across datasets, except for NoQA baselines.
### Interpretation
The data suggests that:
- **Q-Anchored methods** leverage model capacity more effectively, particularly for complex datasets like HotpotQA.
- **Larger models (3B)** maintain higher accuracy but show greater sensitivity to layer depth, with performance drops in later layers.
- **NoQA baselines** indicate that anchoring methods provide meaningful improvements over random guessing, especially for TriviaQA and HotpotQA.
- The sharp declines in accuracy at specific layers (e.g., layer 15 in 1B, layer 20 in 3B) may reflect architectural bottlenecks or dataset-specific challenges in deeper layers.
*Note: All values are approximate due to the absence of gridlines and exact numerical labels. Confidence intervals suggest measurement uncertainty, particularly in volatile regions.*