## Line Chart: RM@K Accuracy vs. Number of Samples
### Overview
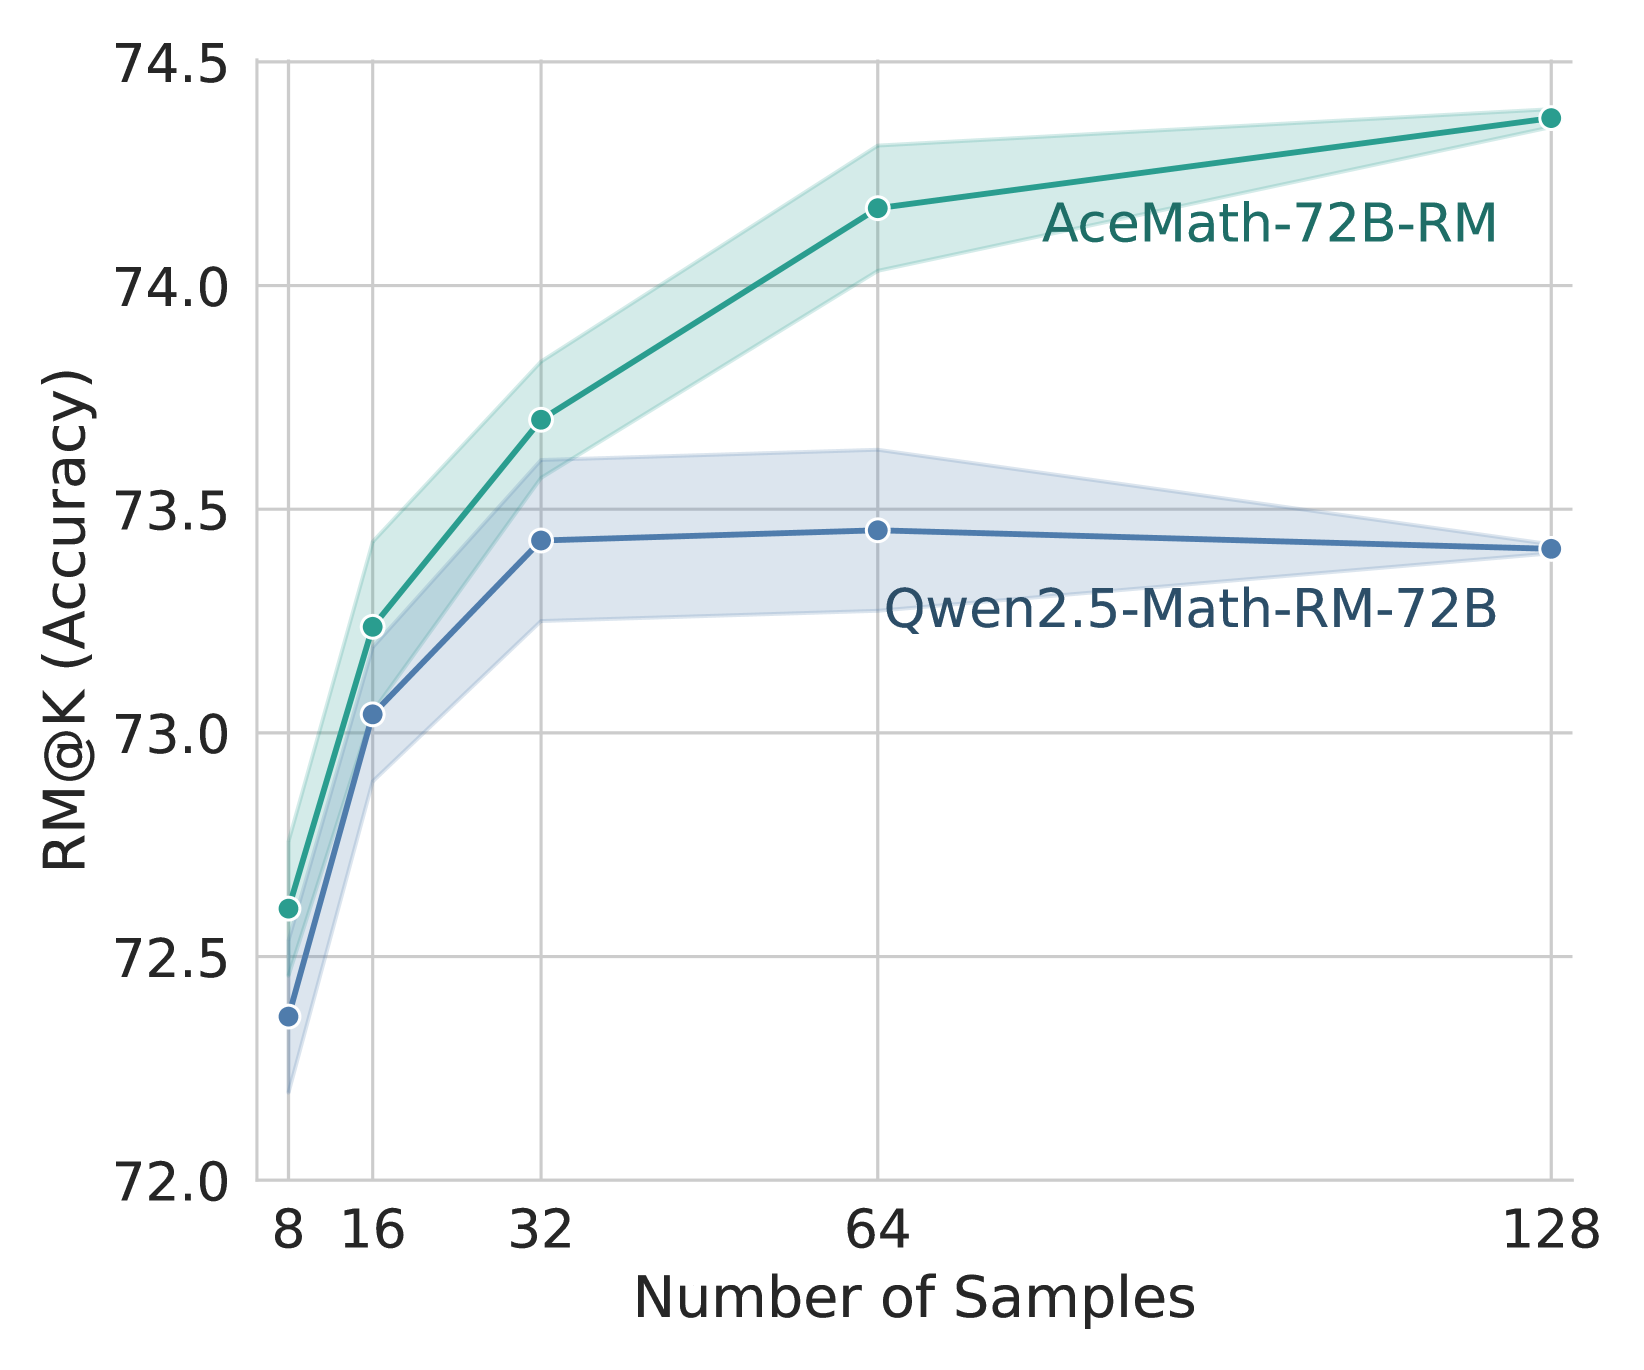
The image is a line chart comparing the RM@K (Accuracy) of two models, AceMath-72B-RM and Qwen2.5-Math-RM-72B, across different numbers of samples. The x-axis represents the number of samples, and the y-axis represents the RM@K accuracy. Each line is accompanied by a shaded region indicating the uncertainty or variance in the accuracy.
### Components/Axes
* **X-axis:** Number of Samples, with markers at 8, 16, 32, 64, and 128.
* **Y-axis:** RM@K (Accuracy), ranging from 72.0 to 74.5, with markers at intervals of 0.5.
* **Legend:**
* AceMath-72B-RM (Green line with a light green shaded region)
* Qwen2.5-Math-RM-72B (Blue line with a light blue shaded region)
### Detailed Analysis
* **AceMath-72B-RM (Green):**
* Trend: The line slopes upward, indicating increasing accuracy with more samples.
* Data Points:
* 8 Samples: Approximately 72.6
* 16 Samples: Approximately 73.2
* 32 Samples: Approximately 73.7
* 64 Samples: Approximately 74.2
* 128 Samples: Approximately 74.4
* **Qwen2.5-Math-RM-72B (Blue):**
* Trend: The line slopes upward initially, then plateaus.
* Data Points:
* 8 Samples: Approximately 72.3
* 16 Samples: Approximately 73.1
* 32 Samples: Approximately 73.4
* 64 Samples: Approximately 73.4
* 128 Samples: Approximately 73.4
### Key Observations
* AceMath-72B-RM consistently outperforms Qwen2.5-Math-RM-72B across all sample sizes.
* The accuracy of AceMath-72B-RM continues to increase with the number of samples, while the accuracy of Qwen2.5-Math-RM-72B plateaus after 32 samples.
* The shaded regions indicate the uncertainty in the accuracy, with AceMath-72B-RM having a slightly wider uncertainty range.
### Interpretation
The chart suggests that AceMath-72B-RM is a more effective model for this task, as it achieves higher accuracy and continues to improve with more samples. Qwen2.5-Math-RM-72B, on the other hand, reaches a performance ceiling after a certain number of samples. The uncertainty regions provide insight into the variability of the models' performance, which is important for assessing their reliability. The data demonstrates the importance of model selection and the impact of sample size on model accuracy.