## Line Chart: RM@K Accuracy vs. Number of Samples
### Overview
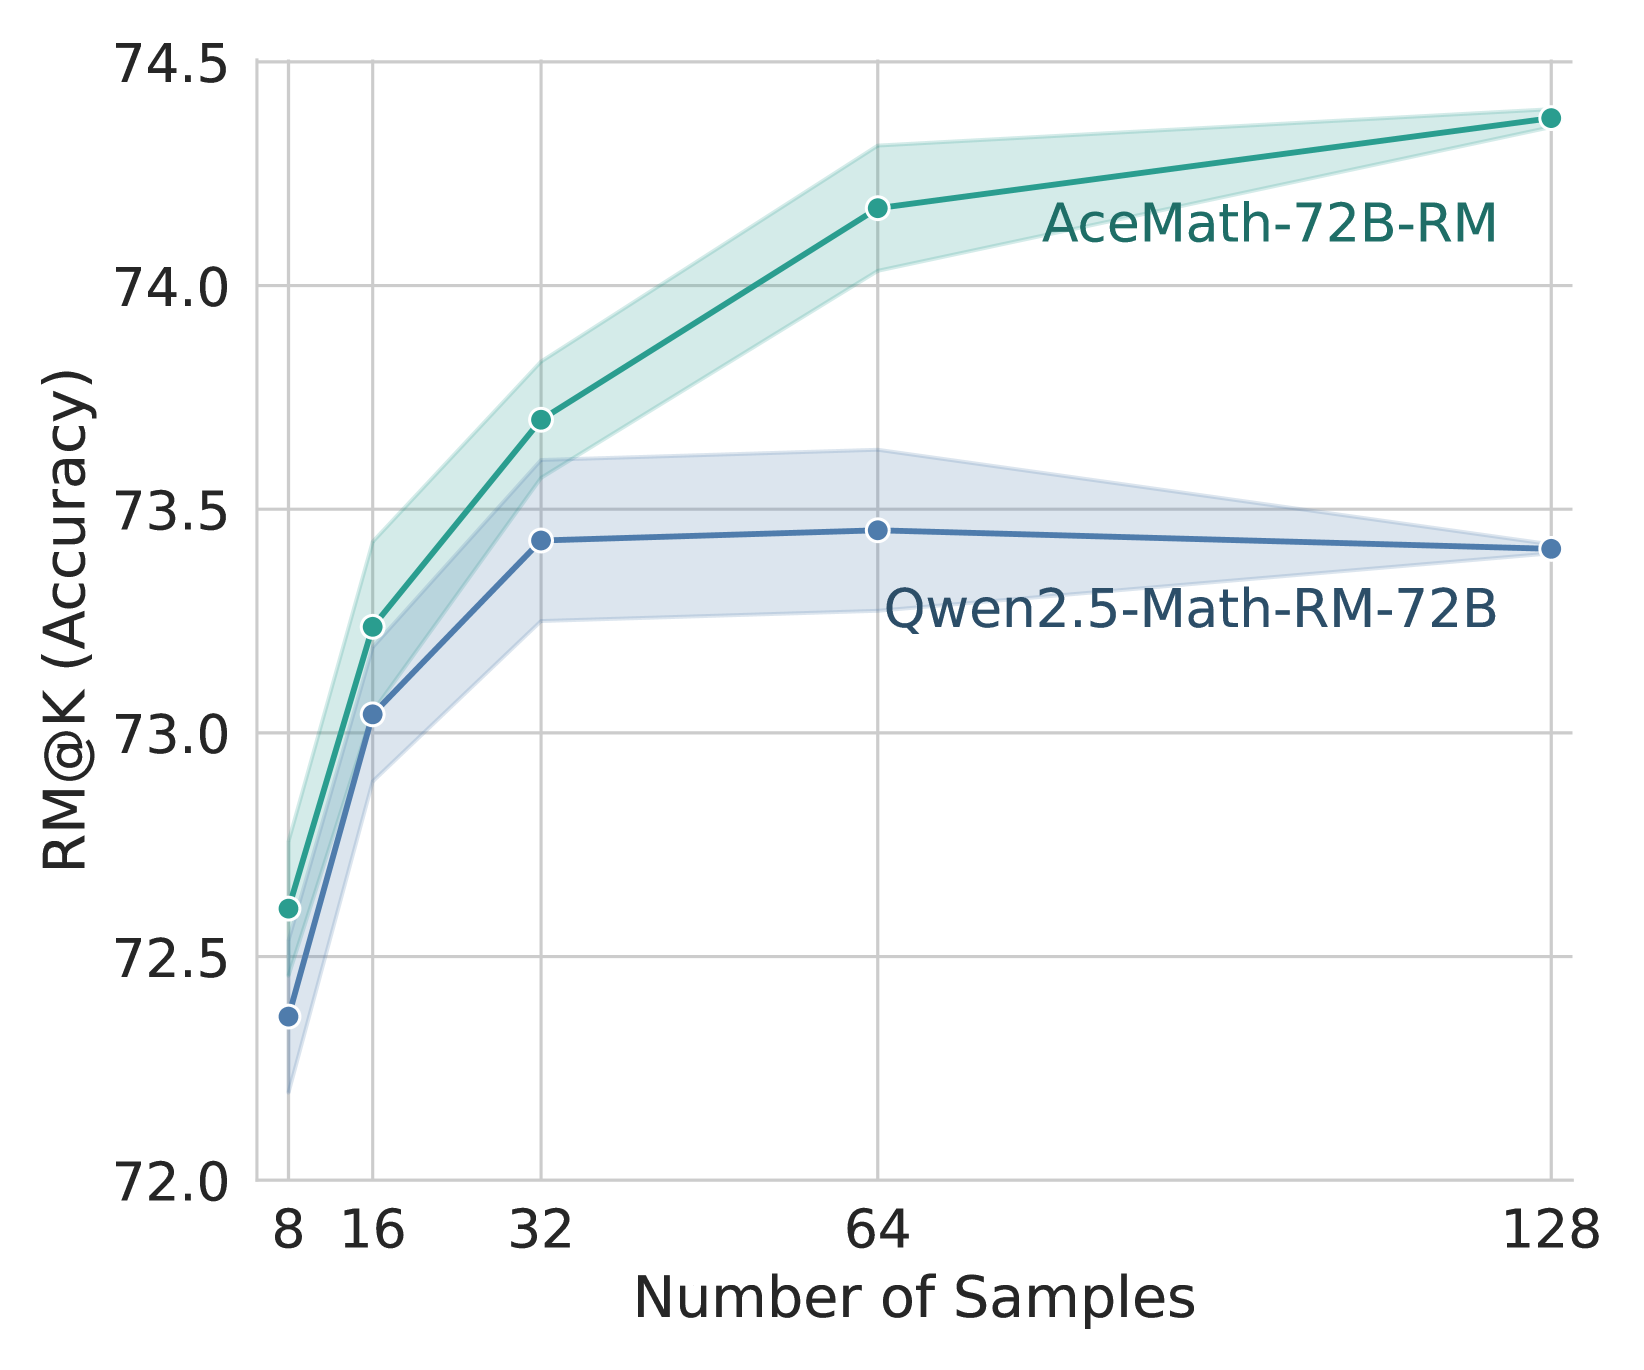
This image is a line chart illustrating the performance of two Reward Models (RM), "AceMath-72B-RM" and "Qwen2.5-Math-RM-72B," across varying numbers of samples (8, 16, 32, 64, 128). The chart plots "RM@K (Accuracy)" on the Y-axis against the "Number of Samples" on the X-axis. Shaded regions around each line represent the uncertainty or variance associated with the accuracy measurements at each data point.
### Components/Axes
* **X-Axis:** Labeled "Number of Samples." The scale is logarithmic, with markers at 8, 16, 32, 64, and 128.
* **Y-Axis:** Labeled "RM@K (Accuracy)." The scale is linear, ranging from 72.0 to 74.5 in increments of 0.5.
* **Legend/Labels:**
* **AceMath-72B-RM:** Indicated by a teal line and teal shaded region. The label is positioned in the upper-right quadrant of the chart area.
* **Qwen2.5-Math-RM-72B:** Indicated by a blue line and blue shaded region. The label is positioned in the middle-right area of the chart.
### Detailed Analysis
The chart displays two distinct data series. Below are the approximate values extracted from the plot points:
| Number of Samples | AceMath-72B-RM (Accuracy) | Qwen2.5-Math-RM-72B (Accuracy) |
| :--- | :--- | :--- |
| 8 | ~72.6% | ~72.4% |
| 16 | ~73.25% | ~73.05% |
| 32 | ~73.7% | ~73.45% |
| 64 | ~74.2% | ~73.45% |
| 128 | ~74.4% | ~73.4% |
**1. AceMath-72B-RM (Teal Line)**
* **Trend:** The line shows a consistent, strong upward trend across all sample sizes. It does not appear to plateau within the tested range.
**2. Qwen2.5-Math-RM-72B (Blue Line)**
* **Trend:** The line shows an initial upward trend from 8 to 32 samples, followed by a plateau and a slight, negligible decline between 64 and 128 samples.
### Key Observations
* **Performance Gap:** AceMath-72B-RM consistently outperforms Qwen2.5-Math-RM-72B at every sample size interval.
* **Divergence:** The performance gap between the two models widens as the number of samples increases. At 8 samples, the difference is approximately 0.2%; at 128 samples, the difference increases to approximately 1.0%.
* **Scalability:** AceMath-72B-RM demonstrates better scalability; its accuracy continues to improve as the sample size increases. Conversely, Qwen2.5-Math-RM-72B exhibits diminishing returns, effectively hitting a performance ceiling after 32 samples.
* **Uncertainty:** The shaded regions (confidence intervals) are widest at the lowest sample count (8) and narrow as the sample count increases, indicating higher measurement certainty at larger sample sizes.
### Interpretation
The data suggests that AceMath-72B-RM is a more robust reward model for this specific task, particularly when provided with larger datasets. The Qwen2.5-Math-RM-72B model appears to reach a saturation point at 32 samples, where increasing the sample size further provides no additional accuracy benefit and may even introduce slight variance or degradation. This indicates that for the Qwen model, computational resources spent on processing more than 32 samples for this specific RM@K metric may be inefficient. In contrast, the AceMath model's upward trajectory suggests it is better optimized to leverage additional data for improved accuracy.