\n
## Line Chart: RM@K Accuracy vs. Number of Samples
### Overview
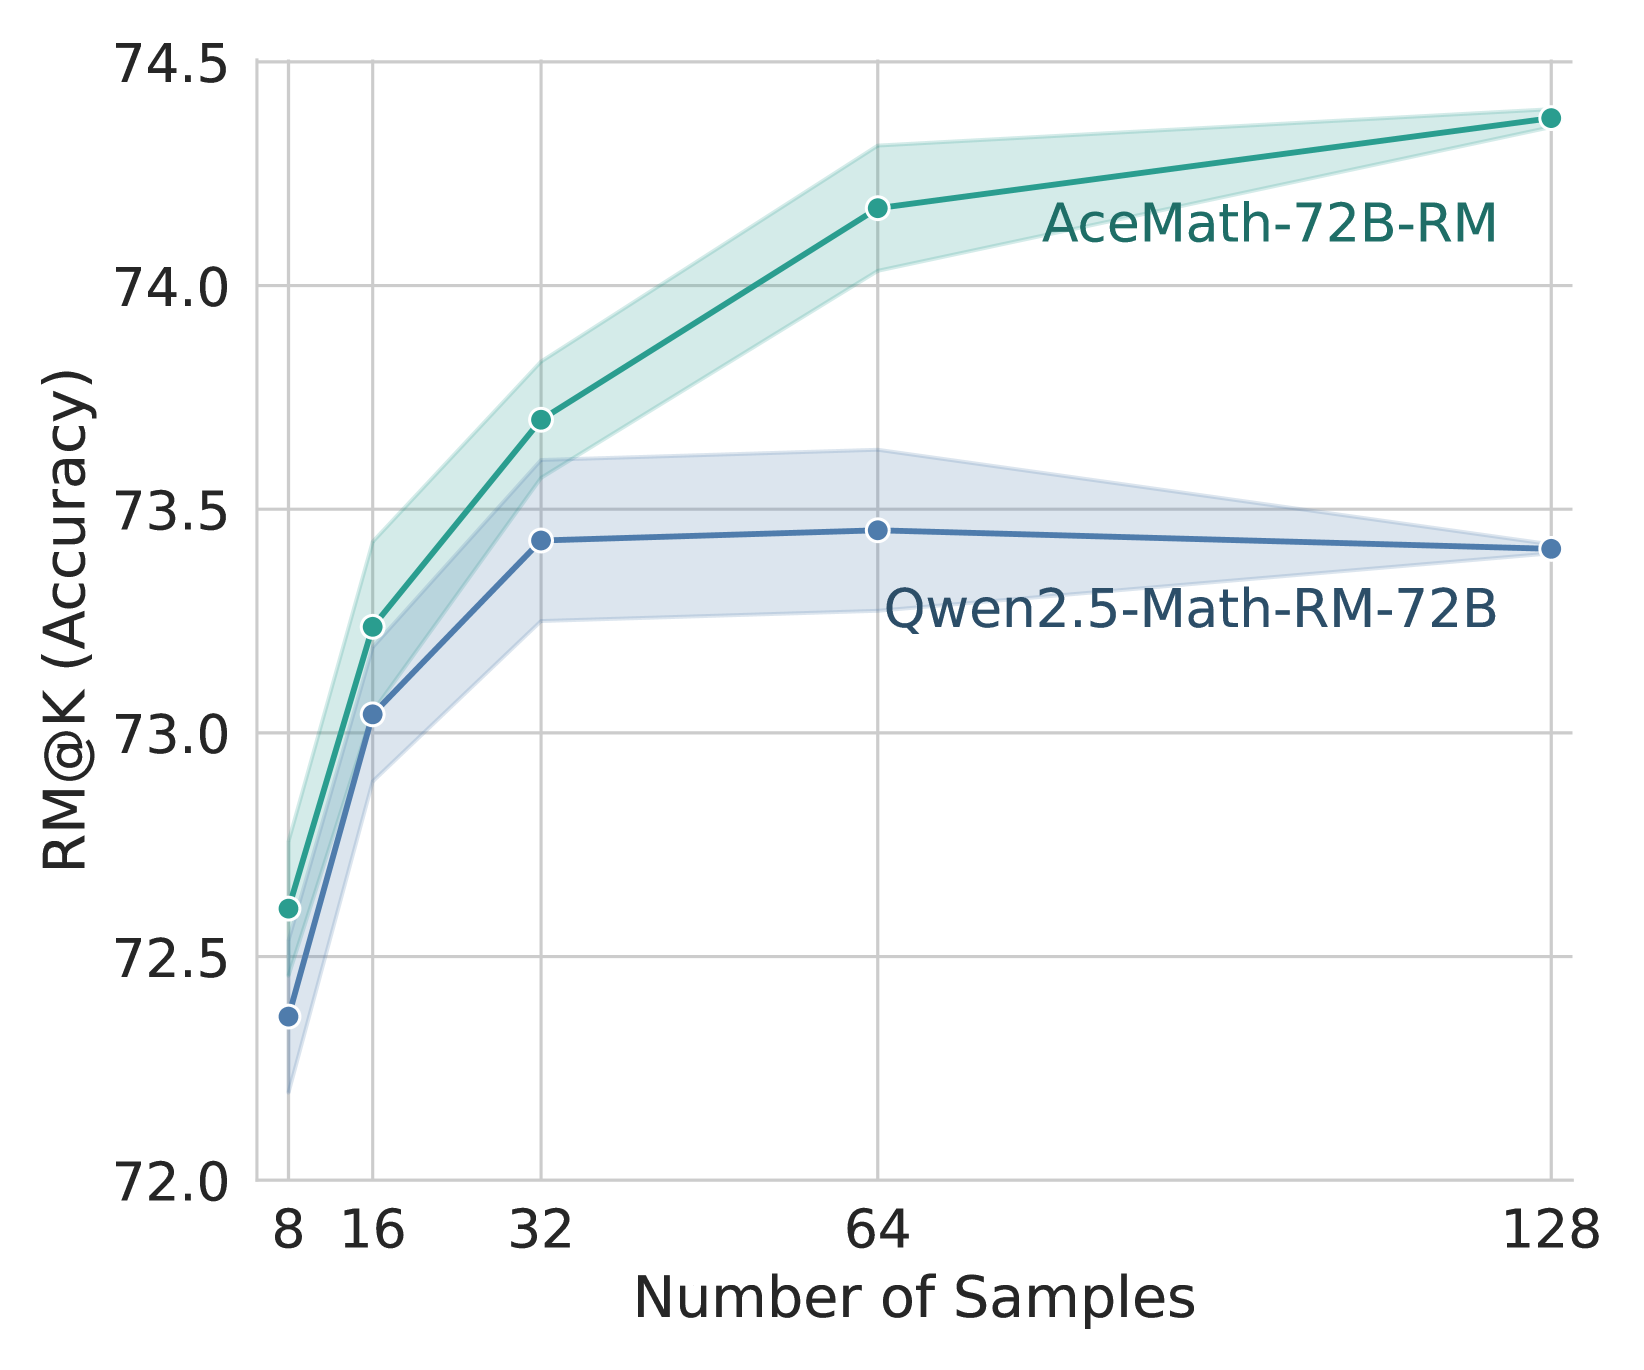
This line chart compares the RM@K (Accuracy) of two models, AceMath-72B-RM and Qwen2.5-Math-RM-72B, across varying numbers of samples. The chart displays the accuracy as a function of the number of samples used, with confidence intervals represented by shaded areas around each line.
### Components/Axes
* **X-axis:** Number of Samples. Scale ranges from 8 to 128, with markers at 8, 16, 32, 64, and 128.
* **Y-axis:** RM@K (Accuracy). Scale ranges from 72.0 to 74.5, with markers at 72.0, 72.5, 73.0, 73.5, 74.0, and 74.5.
* **Data Series 1:** AceMath-72B-RM (represented by a green line with a lighter green shaded confidence interval).
* **Data Series 2:** Qwen2.5-Math-RM-72B (represented by a blue line).
* **Legend:** Located in the top-right corner, labeling each line with its corresponding model name.
### Detailed Analysis
**AceMath-72B-RM (Green Line):**
The green line representing AceMath-72B-RM exhibits a generally upward trend, indicating increasing accuracy with a larger number of samples.
* At 8 samples: Approximately 72.2 (± 0.1)
* At 16 samples: Approximately 73.0 (± 0.1)
* At 32 samples: Approximately 73.7 (± 0.1)
* At 64 samples: Approximately 74.2 (± 0.1)
* At 128 samples: Approximately 74.4 (± 0.1)
**Qwen2.5-Math-RM-72B (Blue Line):**
The blue line representing Qwen2.5-Math-RM-72B shows an initial increase in accuracy, followed by a plateau.
* At 8 samples: Approximately 72.1
* At 16 samples: Approximately 73.0
* At 32 samples: Approximately 73.4
* At 64 samples: Approximately 73.6
* At 128 samples: Approximately 73.2
The confidence interval for AceMath-72B-RM is relatively consistent across all sample sizes, indicating stable performance.
### Key Observations
* AceMath-72B-RM consistently outperforms Qwen2.5-Math-RM-72B across all sample sizes.
* The accuracy of Qwen2.5-Math-RM-72B plateaus after 32 samples, suggesting diminishing returns from increasing the sample size.
* AceMath-72B-RM continues to improve in accuracy even at the highest sample size (128).
* The confidence interval for AceMath-72B-RM is narrow, indicating a reliable and consistent performance.
### Interpretation
The data suggests that AceMath-72B-RM is a more scalable model than Qwen2.5-Math-RM-72B, as its accuracy continues to improve with more samples. Qwen2.5-Math-RM-72B reaches a performance limit relatively quickly. The consistent confidence interval for AceMath-72B-RM indicates that its performance is less sensitive to the specific samples used, making it a more robust choice. The difference in performance between the two models could be attributed to differences in their architectures, training data, or optimization strategies. The RM@K metric likely represents a rank-based accuracy measure, where a higher value indicates better performance in ranking correct answers among a set of candidates. The plateauing of Qwen2.5-Math-RM-72B suggests that it may have reached its capacity to learn from the given data or that the ranking task becomes saturated with its current capabilities.