## Line Chart: Accuracy of Different Models
### Overview
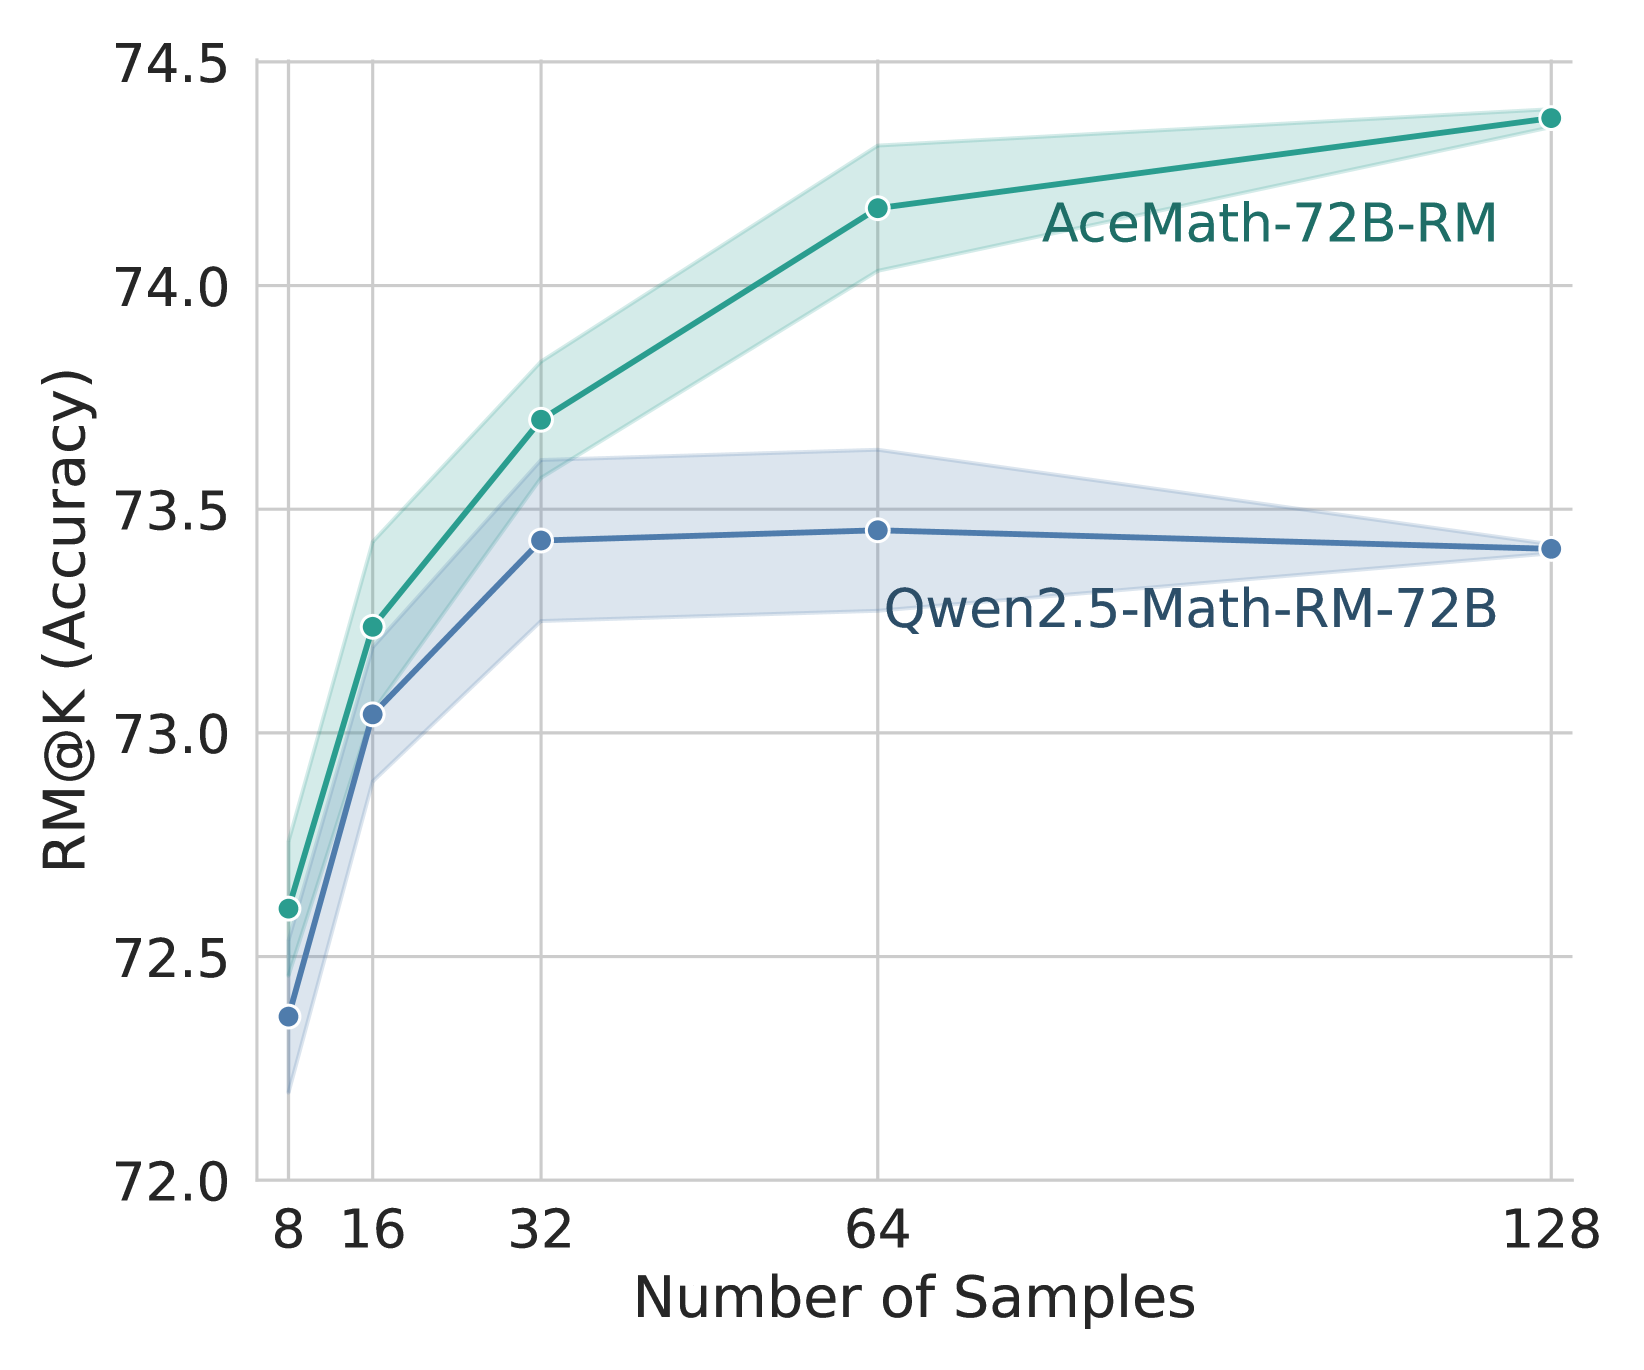
The line chart displays the accuracy of two models, AceMath-72B-RM and Qwen2.5-Math-RM-72B, across different numbers of samples. The x-axis represents the number of samples, while the y-axis represents the accuracy measured as RM@K.
### Components/Axes
- **X-Axis**: Number of Samples
- **Y-Axis**: RM@K (Accuracy)
- **Legend**: Two lines, one for AceMath-72B-RM and one for Qwen2.5-Math-RM-72B
- **Data Points**: Two lines, one for AceMath-72B-RM and one for Qwen2.5-Math-RM-72B
### Detailed Analysis or ### Content Details
- **AceMath-72B-RM**: The line starts at a lower accuracy with fewer samples and increases steadily as the number of samples increases. It reaches an accuracy of approximately 74.5% with 128 samples.
- **Qwen2.5-Math-RM-72B**: The line starts at a higher accuracy with fewer samples and shows a slight decrease as the number of samples increases. It reaches an accuracy of approximately 73.5% with 128 samples.
### Key Observations
- **AceMath-72B-RM** consistently shows higher accuracy across all sample sizes compared to **Qwen2.5-Math-RM-72B**.
- **Qwen2.5-Math-RM-72B** shows a slight decrease in accuracy as the number of samples increases, which might indicate a trade-off between accuracy and computational efficiency.
### Interpretation
The data suggests that **AceMath-72B-RM** is more accurate than **Qwen2.5-Math-RM-72B** across all sample sizes tested. This could be due to the model's architecture or training data. However, **Qwen2.5-Math-RM-72B** might be more efficient in terms of computational resources, as indicated by its slightly lower accuracy at higher sample sizes. The slight decrease in accuracy for **Qwen2.5-Math-RM-72B** might be a deliberate design choice to balance accuracy and efficiency.