## Line Graph: RM@K Accuracy vs. Number of Samples
### Overview
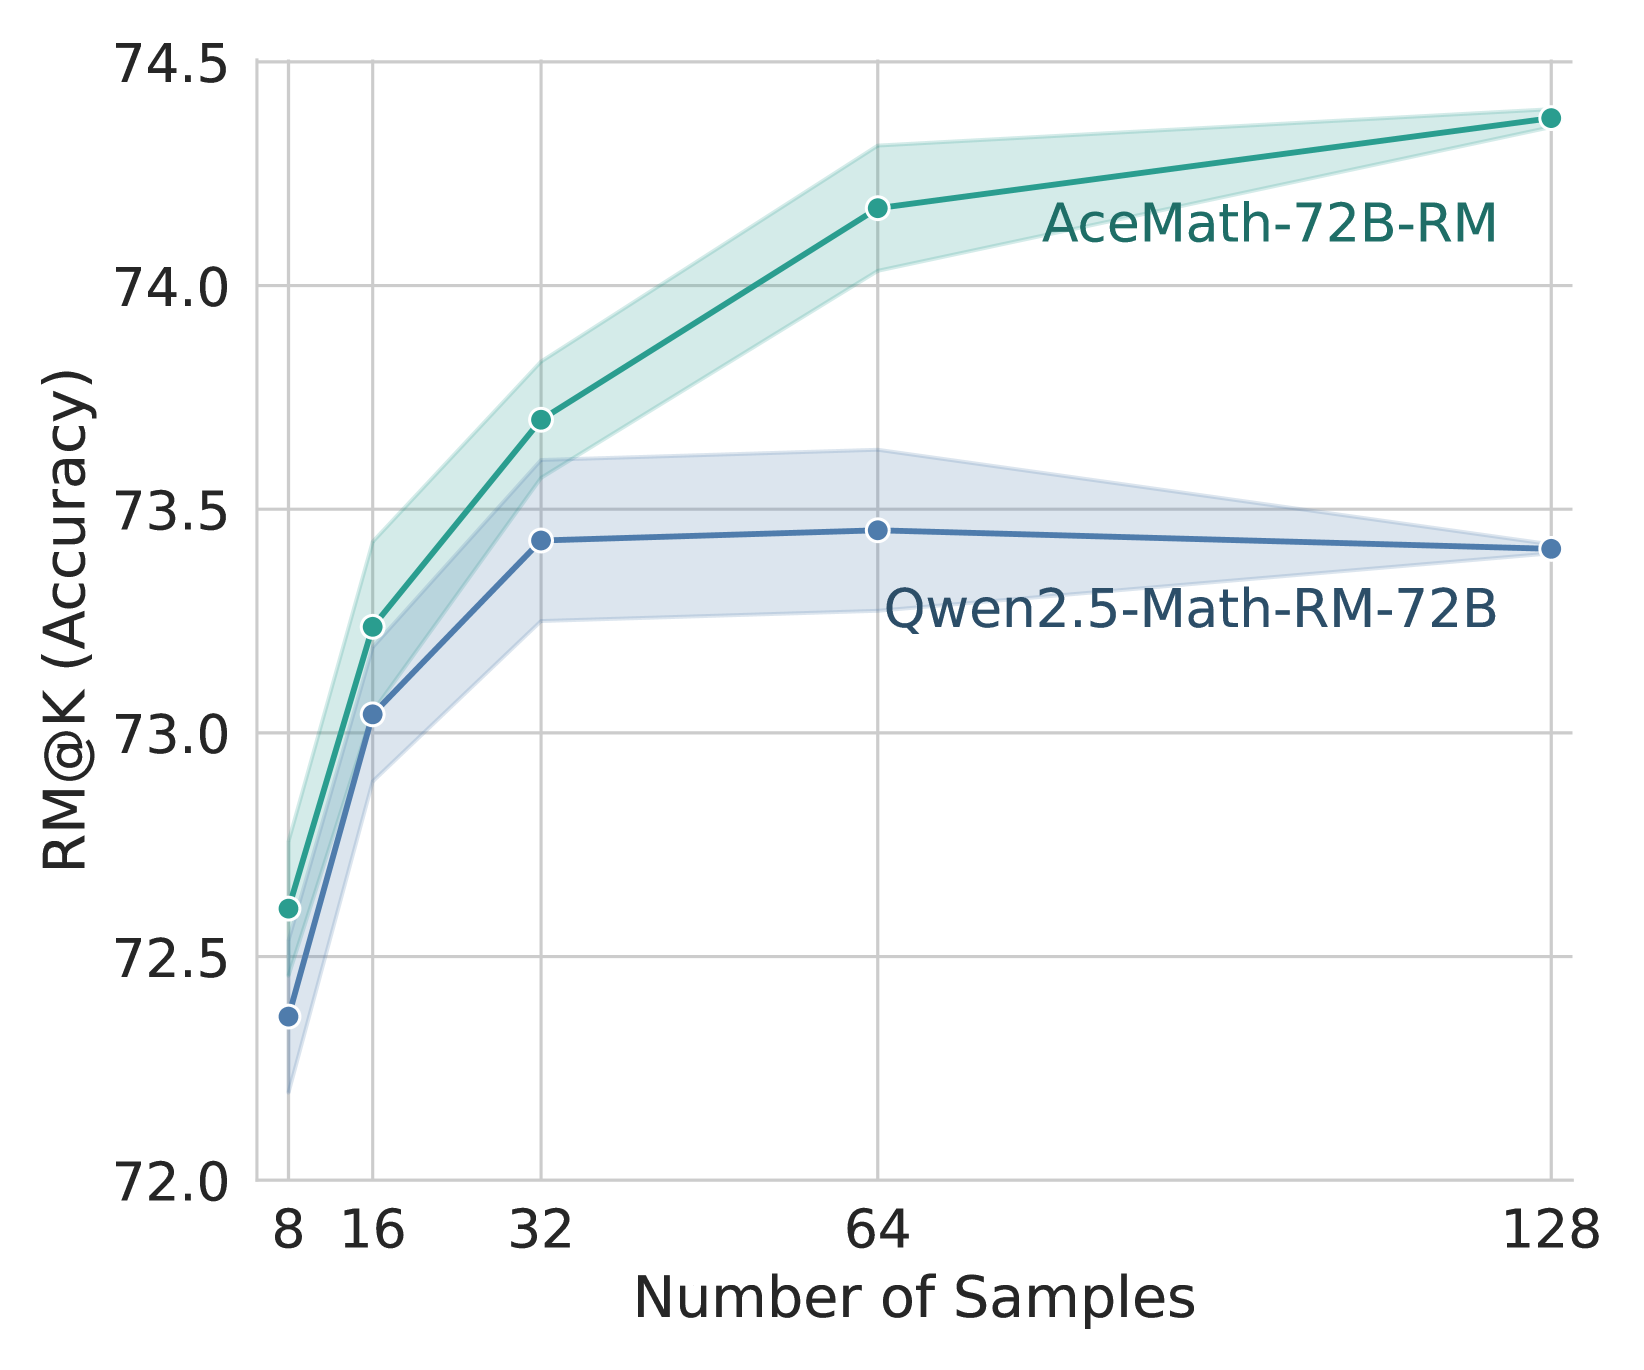
The image is a line graph comparing the RM@K (Recall at K) accuracy of two mathematical reasoning models: **AceMath-72B-RM** (green line) and **Qwen2.5-Math-RM-72B** (blue line). The x-axis represents the number of training samples (8, 16, 32, 64, 128), and the y-axis shows RM@K accuracy (72.0–74.5). Both lines include shaded confidence intervals.
---
### Components/Axes
- **X-axis**: "Number of Samples" (logarithmic scale: 8, 16, 32, 64, 128).
- **Y-axis**: "RM@K (Accuracy)" (linear scale: 72.0–74.5).
- **Legend**: Located in the top-right corner, with:
- **Green line**: AceMath-72B-RM.
- **Blue line**: Qwen2.5-Math-RM-72B.
- **Shaded Regions**: Represent confidence intervals (uncertainty) around each line.
---
### Detailed Analysis
#### AceMath-72B-RM (Green Line)
- **Trend**: Steadily increases from ~72.6 (8 samples) to ~74.4 (128 samples).
- **Key Points**:
- 8 samples: 72.6 (±0.3).
- 16 samples: 73.2 (±0.4).
- 32 samples: 73.7 (±0.5).
- 64 samples: 74.2 (±0.3).
- 128 samples: 74.4 (±0.2).
- **Confidence Interval**: Widest at 32 samples (73.2–74.2), narrowing at extremes.
#### Qwen2.5-Math-RM-72B (Blue Line)
- **Trend**: Rises sharply to 32 samples, then plateaus.
- **Key Points**:
- 8 samples: 72.3 (±0.5).
- 16 samples: 73.0 (±0.4).
- 32 samples: 73.4 (±0.3).
- 64 samples: 73.5 (±0.3).
- 128 samples: 73.4 (±0.2).
- **Confidence Interval**: Narrowest at 8 samples, widening slightly at 32 samples.
---
### Key Observations
1. **Performance Gap**: AceMath-72B-RM consistently outperforms Qwen2.5-Math-RM-72B after 32 samples.
2. **Diminishing Returns**: Both models show reduced improvement beyond 64 samples.
3. **Uncertainty**: AceMath-72B-RM exhibits higher variability (wider shaded regions) than Qwen2.5-Math-RM-72B.
---
### Interpretation
- **Model Efficiency**: AceMath-72B-RM benefits more from increased training data, suggesting better generalization or architecture suited to larger datasets.
- **Stability**: Qwen2.5-Math-RM-72B stabilizes at ~73.4 RM@K, indicating potential saturation or overfitting at smaller sample sizes.
- **Practical Implications**: For applications requiring high accuracy with limited data, Qwen2.5-Math-RM-72B may be preferable. For large-scale deployments, AceMath-72B-RM offers superior long-term gains.
*Note: All values are approximate, derived from visual inspection of the graph. Confidence intervals are inferred from shaded regions.*