## Line Chart: Probability Distribution at T = 0.31, Instance 2
### Overview
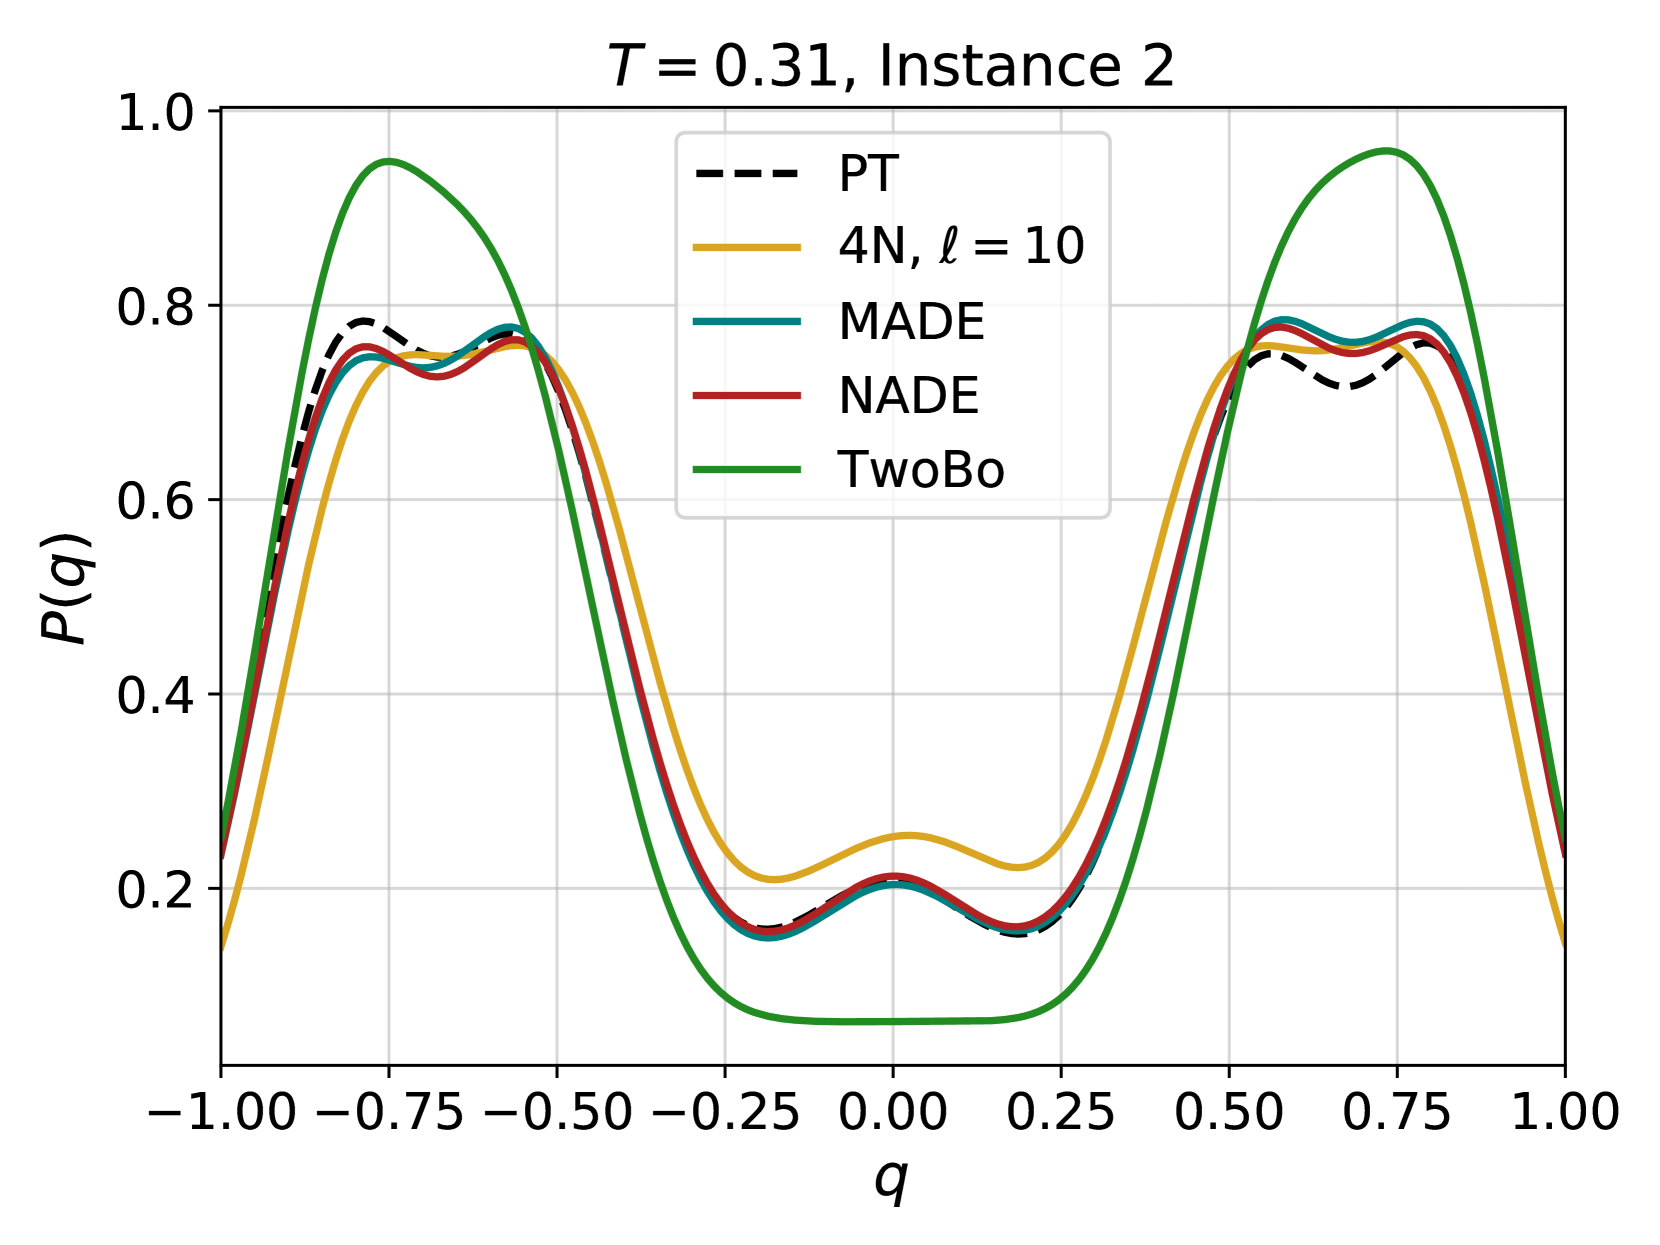
The chart displays probability distributions (P(q)) for five distinct models/methods across a normalized variable q (-1.00 to 1.00). All distributions exhibit U-shaped curves with peaks in the positive q range, suggesting asymmetric probability distributions centered around q ≈ 0.7–0.8.
### Components/Axes
- **X-axis (q)**: Ranges from -1.00 to 1.00 in increments of 0.25.
- **Y-axis (P(q))**: Probability values from 0.2 to 1.0 in increments of 0.2.
- **Legend**: Located in the top-right corner, mapping line styles/colors to models:
- **PT**: Dashed black line
- **4N, ℓ = 10**: Solid yellow line
- **MADE**: Solid blue line
- **NADE**: Solid red line
- **TwoBo**: Solid green line
### Detailed Analysis
1. **PT (Dashed Black)**:
- Peaks at q ≈ 0.8 with P(q) ≈ 0.9.
- Shows a minor dip at q ≈ -0.5 (P(q) ≈ 0.75).
- Smooth curve with no oscillations.
2. **4N, ℓ = 10 (Solid Yellow)**:
- Peaks at q ≈ 0.7 with P(q) ≈ 0.85.
- Deeper trough at q ≈ 0.0 (P(q) ≈ 0.25).
- Slightly asymmetric compared to other models.
3. **MADE (Solid Blue)**:
- Peaks at q ≈ 0.8 with P(q) ≈ 0.88.
- Overlaps closely with NADE and TwoBo.
- Minimal curvature in the negative q range.
4. **NADE (Solid Red)**:
- Peaks at q ≈ 0.8 with P(q) ≈ 0.87.
- Nearly identical to MADE, suggesting similar modeling assumptions.
- Slightly sharper peak than MADE.
5. **TwoBo (Solid Green)**:
- Peaks at q ≈ 0.8 with P(q) ≈ 0.92.
- Smoothest curve with the highest peak.
- No visible oscillations or troughs.
### Key Observations
- **Peak Consistency**: All models peak near q = 0.8, but TwoBo has the highest probability (0.92) at this point.
- **Asymmetry**: The 4N model shows the most pronounced asymmetry, with a lower probability at q = -1.0 (≈0.2) compared to q = 1.0 (≈0.85).
- **Overlap**: MADE and NADE are nearly indistinguishable, differing by <0.01 in peak P(q).
- **PT vs. TwoBo**: PT’s peak is 0.03 lower than TwoBo’s, but its curve is smoother.
### Interpretation
The data suggests that **TwoBo** produces the most concentrated probability distribution at q ≈ 0.8, potentially indicating superior performance or confidence in this region. The **4N model** (ℓ = 10) exhibits the widest spread, possibly due to parameter constraints (ℓ = 10) or modeling limitations. The near-identical performance of MADE and NADE implies they may share architectural or methodological similarities. The PT model’s smoothness contrasts with the oscillatory behavior of other models, hinting at differing regularization or optimization strategies. The consistent peak near q = 0.8 across models suggests a shared underlying assumption about the system’s behavior at this parameter value.