## Line Charts: Brain Alignment vs. Number of Tokens for Pythia Models
### Overview
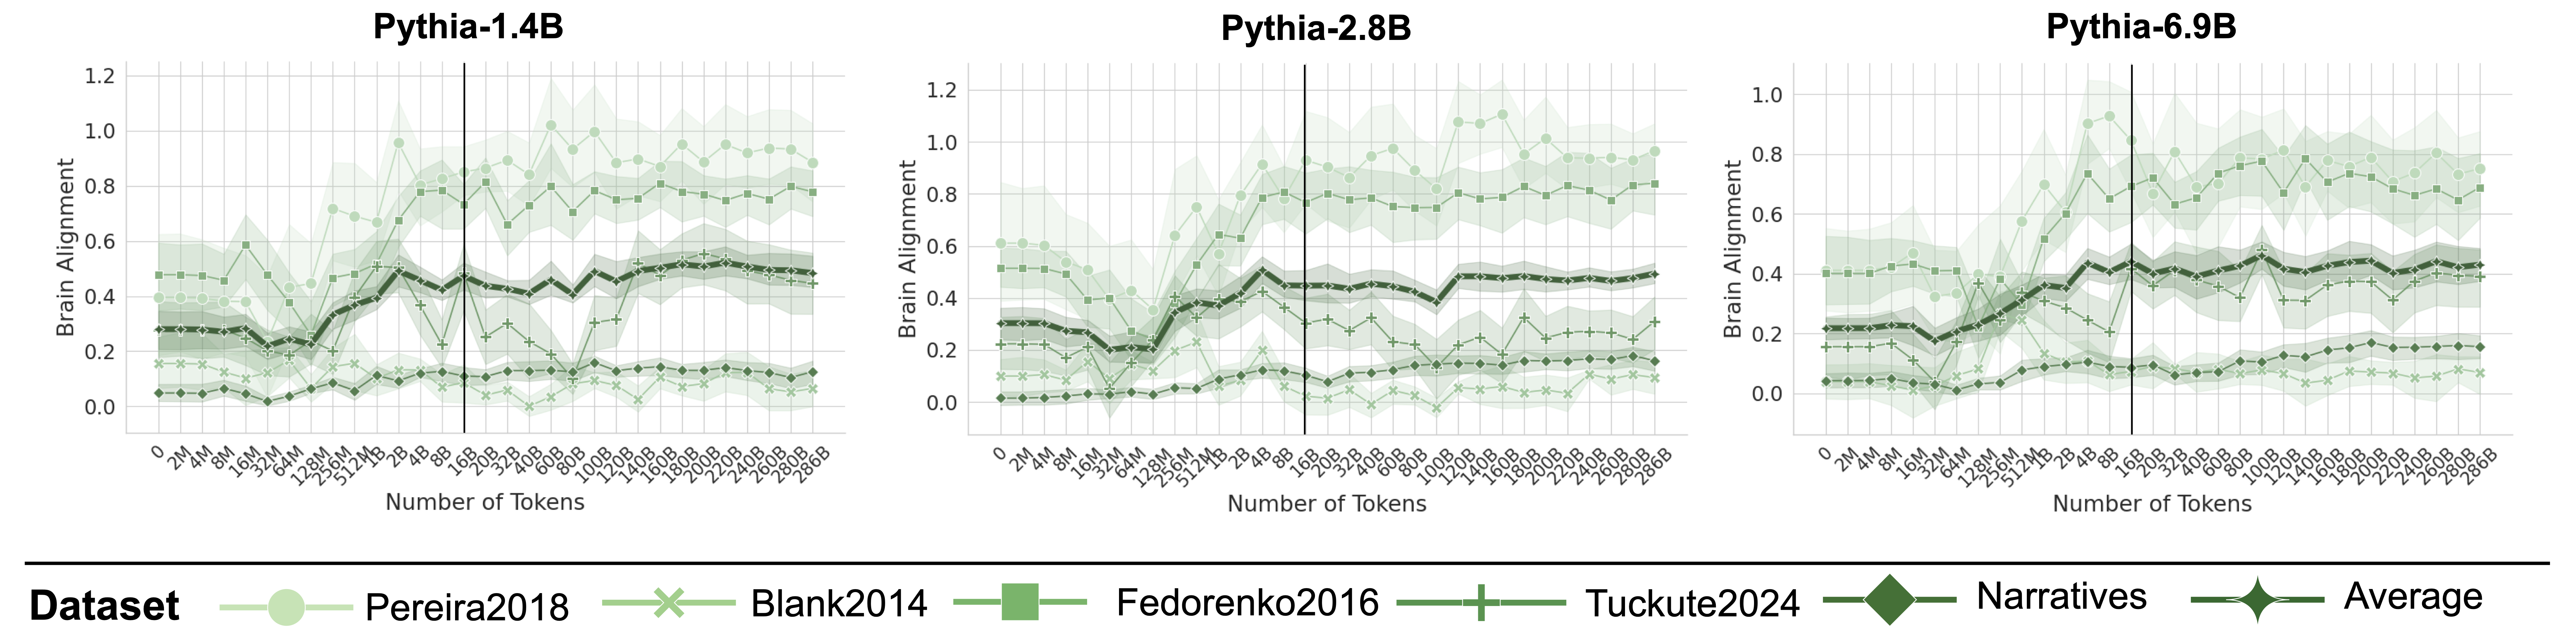
The image presents three line charts comparing the brain alignment scores of different datasets against the number of tokens processed by three Pythia language models (1.4B, 2.8B, and 6.9B). Each chart displays multiple data series, each representing a different dataset, with the x-axis indicating the number of tokens and the y-axis indicating the brain alignment score. A vertical line is present in each chart, but its significance is not explicitly stated.
### Components/Axes
* **Titles:**
* Top-left chart: "Pythia-1.4B"
* Top-middle chart: "Pythia-2.8B"
* Top-right chart: "Pythia-6.9B"
* **Y-axis (Brain Alignment):**
* Left chart: Scale from 0.0 to 1.2, with increments of 0.2.
* Middle chart: Scale from 0.0 to 1.2, with increments of 0.2.
* Right chart: Scale from 0.0 to 1.0, with increments of 0.2.
* **X-axis (Number of Tokens):**
* All charts: Non-linear scale with labels "0", "2M", "4M", "8M", "16M", "32M", "64M", "128M", "256M", "512M", "1B", "2B", "4B", "8B", "16B", "20B", "32B", "40B", "60B", "80B", "100B", "120B", "140B", "160B", "180B", "200B", "220B", "240B", "260B", "280B", "286B".
* **Legend (bottom):**
* "Pereira2018" (light green circles)
* "Blank2014" (light green x marks)
* "Fedorenko2016" (light green squares)
* "Tuckute2024" (light green plus signs)
* "Narratives" (dark green diamonds)
* "Average" (dark green line with diamond markers, and shaded region indicating variance)
### Detailed Analysis
**Pythia-1.4B:**
* **Pereira2018 (light green circles):** Starts around 0.05, increases sharply around 64M tokens to approximately 0.8, then fluctuates between 0.7 and 1.0.
* **Blank2014 (light green x marks):** Remains relatively flat around 0.1 for the entire range.
* **Fedorenko2016 (light green squares):** Starts around 0.1, increases to approximately 0.6 around 64M tokens, then fluctuates between 0.4 and 0.6.
* **Tuckute2024 (light green plus signs):** Starts around 0.2, increases slightly to approximately 0.3 around 64M tokens, then remains relatively flat.
* **Narratives (dark green diamonds):** Starts around 0.2, increases to approximately 0.4 around 16M tokens, then remains relatively flat.
* **Average (dark green line with diamond markers):** Starts around 0.2, increases to approximately 0.5 around 16M tokens, then remains relatively flat.
**Pythia-2.8B:**
* **Pereira2018 (light green circles):** Starts around 0.05, increases sharply around 64M tokens to approximately 0.9, then fluctuates between 0.7 and 1.1.
* **Blank2014 (light green x marks):** Remains relatively flat around 0.1 for the entire range.
* **Fedorenko2016 (light green squares):** Starts around 0.1, increases to approximately 0.6 around 64M tokens, then fluctuates between 0.5 and 0.7.
* **Tuckute2024 (light green plus signs):** Starts around 0.2, increases slightly to approximately 0.3 around 64M tokens, then remains relatively flat.
* **Narratives (dark green diamonds):** Starts around 0.2, increases to approximately 0.4 around 16M tokens, then remains relatively flat.
* **Average (dark green line with diamond markers):** Starts around 0.2, increases to approximately 0.45 around 16M tokens, then remains relatively flat.
**Pythia-6.9B:**
* **Pereira2018 (light green circles):** Starts around 0.4, increases sharply around 64M tokens to approximately 0.8, then fluctuates between 0.7 and 0.9.
* **Blank2014 (light green x marks):** Remains relatively flat around 0.2 for the entire range.
* **Fedorenko2016 (light green squares):** Starts around 0.4, increases to approximately 0.7 around 64M tokens, then fluctuates between 0.6 and 0.8.
* **Tuckute2024 (light green plus signs):** Starts around 0.2, increases slightly to approximately 0.3 around 64M tokens, then remains relatively flat.
* **Narratives (dark green diamonds):** Starts around 0.2, increases to approximately 0.4 around 16M tokens, then remains relatively flat.
* **Average (dark green line with diamond markers):** Starts around 0.2, increases to approximately 0.4 around 16M tokens, then remains relatively flat.
### Key Observations
* The "Pereira2018" and "Fedorenko2016" datasets show a significant increase in brain alignment around 64M tokens for all three Pythia models.
* The "Blank2014" and "Tuckute2024" datasets show relatively flat brain alignment scores across all token counts and models.
* The "Narratives" dataset and the "Average" series show a moderate increase in brain alignment up to 16M tokens, then remain relatively flat.
* The brain alignment scores for "Pereira2018" and "Fedorenko2016" are generally higher than the other datasets.
* The vertical line in each chart is positioned between 8B and 16B tokens.
### Interpretation
The charts suggest that the brain alignment of certain datasets ("Pereira2018" and "Fedorenko2016") is significantly affected by the number of tokens processed by the Pythia models, particularly around 64M tokens. This could indicate a critical learning phase or a change in the model's representation of these datasets at that point. The relatively flat brain alignment scores for "Blank2014" and "Tuckute2024" suggest that these datasets may not be as effectively processed or represented by the models. The "Narratives" dataset and the "Average" series show a more gradual increase in brain alignment, indicating a more consistent but less dramatic learning pattern. The vertical line may represent a significant milestone in the training process or a specific point of comparison across the models. The increasing model size (1.4B, 2.8B, 6.9B) does not appear to drastically change the overall trends, but it may influence the absolute brain alignment scores for some datasets.