\n
## Line Chart: Brain Alignment vs. Number of Tokens for Pythia Models
### Overview
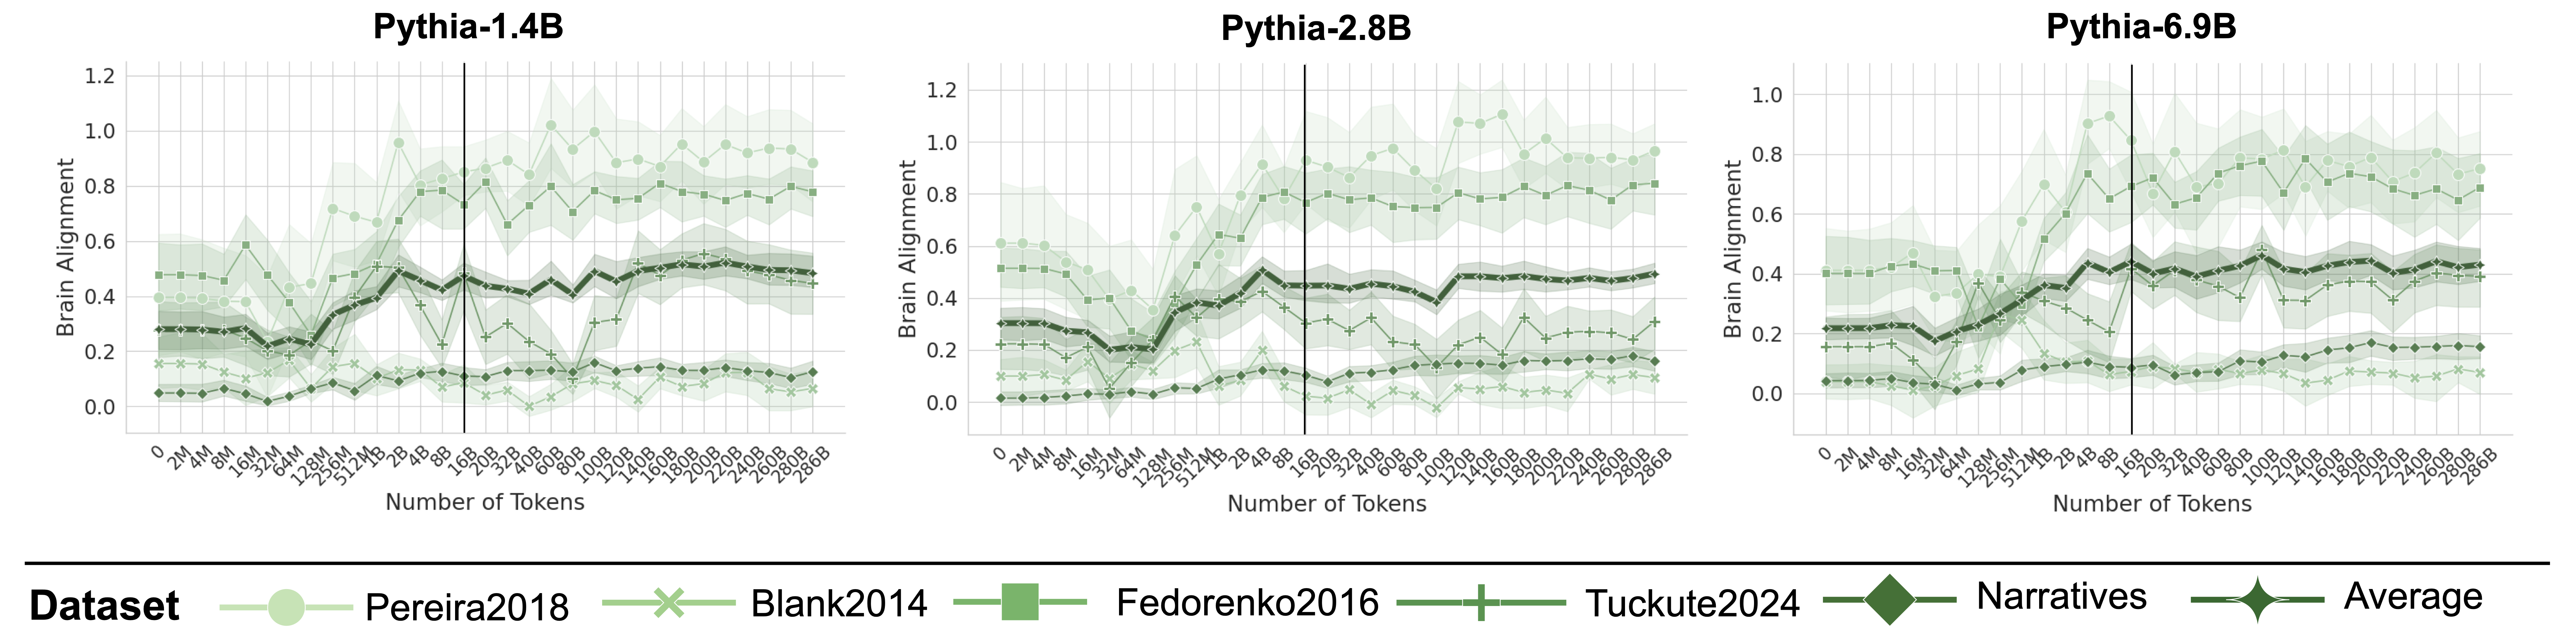
The image presents three line charts, each displaying the relationship between "Brain Alignment" and "Number of Tokens" for different Pythia language models: Pythia-1.4B, Pythia-2.8B, and Pythia-6.9B. Each chart plots the brain alignment scores for several datasets as a function of the number of tokens. A legend at the bottom identifies the datasets and their corresponding line colors.
### Components/Axes
* **X-axis:** "Number of Tokens" - Ranges from approximately 0 to 1000 tokens. The scale is linear.
* **Y-axis:** "Brain Alignment" - Ranges from 0.0 to 1.2 (varying slightly between charts). The scale is linear.
* **Charts:** Three separate charts, one for each Pythia model:
* Pythia-1.4B
* Pythia-2.8B
* Pythia-6.9B
* **Legend:** Located at the bottom of the image. It identifies the datasets represented by each line color:
* Pereira2018 (Light Green)
* Blank2014 (Light Blue)
* Fedorenko2016 (Dark Green)
* Tuckute2024 (Light Grey)
* Narratives (Dark Grey)
* Average (Black)
### Detailed Analysis or Content Details
**Pythia-1.4B:**
* **Pereira2018 (Light Green):** Line starts at approximately 0.2, fluctuates between 0.2 and 0.4, with a slight upward trend towards the end, reaching around 0.45.
* **Blank2014 (Light Blue):** Line starts at approximately 0.05, remains relatively low, fluctuating between 0.0 and 0.15.
* **Fedorenko2016 (Dark Green):** Line starts at approximately 0.3, increases to a peak of around 0.5 at approximately 200 tokens, then declines to around 0.3.
* **Tuckute2024 (Light Grey):** Line starts at approximately 0.05, fluctuates between 0.0 and 0.2.
* **Narratives (Dark Grey):** Line starts at approximately 0.1, fluctuates between 0.05 and 0.25.
* **Average (Black):** Line starts at approximately 0.2, increases to a peak of around 0.35 at approximately 200 tokens, then declines to around 0.25.
**Pythia-2.8B:**
* **Pereira2018 (Light Green):** Line starts at approximately 0.3, increases to a peak of around 0.7 at approximately 400 tokens, then declines to around 0.5.
* **Blank2014 (Light Blue):** Line starts at approximately 0.05, remains relatively low, fluctuating between 0.0 and 0.2.
* **Fedorenko2016 (Dark Green):** Line starts at approximately 0.4, increases to a peak of around 0.8 at approximately 400 tokens, then declines to around 0.6.
* **Tuckute2024 (Light Grey):** Line starts at approximately 0.1, fluctuates between 0.05 and 0.3.
* **Narratives (Dark Grey):** Line starts at approximately 0.15, fluctuates between 0.05 and 0.3.
* **Average (Black):** Line starts at approximately 0.3, increases to a peak of around 0.5 at approximately 400 tokens, then declines to around 0.4.
**Pythia-6.9B:**
* **Pereira2018 (Light Green):** Line starts at approximately 0.4, increases to a peak of around 0.9 at approximately 400 tokens, then declines to around 0.7.
* **Blank2014 (Light Blue):** Line starts at approximately 0.05, remains relatively low, fluctuating between 0.0 and 0.2.
* **Fedorenko2016 (Dark Green):** Line starts at approximately 0.5, increases to a peak of around 0.9 at approximately 400 tokens, then declines to around 0.7.
* **Tuckute2024 (Light Grey):** Line starts at approximately 0.1, fluctuates between 0.05 and 0.3.
* **Narratives (Dark Grey):** Line starts at approximately 0.2, fluctuates between 0.1 and 0.4.
* **Average (Black):** Line starts at approximately 0.4, increases to a peak of around 0.6 at approximately 400 tokens, then declines to around 0.5.
### Key Observations
* The "Average" line generally shows an initial increase in brain alignment with the number of tokens, followed by a decline.
* The "Pereira2018" and "Fedorenko2016" datasets consistently exhibit higher brain alignment scores compared to "Blank2014," "Tuckute2024," and "Narratives."
* As the model size increases (from 1.4B to 6.9B), the peak brain alignment scores generally increase.
* The "Blank2014" dataset consistently shows the lowest brain alignment scores across all models.
### Interpretation
The charts demonstrate how brain alignment, a measure of how well a language model's internal representations correlate with human brain activity, changes as the model processes more tokens. The initial increase in alignment suggests that the model is initially learning to represent information in a way that is more aligned with human understanding. The subsequent decline could indicate that the model is either overfitting to the training data or encountering limitations in its ability to maintain alignment as the context grows.
The differences in alignment scores between datasets suggest that some datasets are more conducive to learning human-like representations than others. The consistently high scores for "Pereira2018" and "Fedorenko2016" might indicate that these datasets contain more naturalistic or cognitively relevant language.
The increasing peak alignment scores with larger model sizes suggest that larger models have a greater capacity to learn and maintain human-aligned representations, at least up to a certain point. However, the decline in alignment after the peak suggests that simply increasing model size is not sufficient to achieve perfect alignment. Further research is needed to understand the factors that contribute to this decline and to develop techniques for improving brain alignment in large language models.