## Line Graphs: Brain Alignment Across Pythia Model Sizes
### Overview
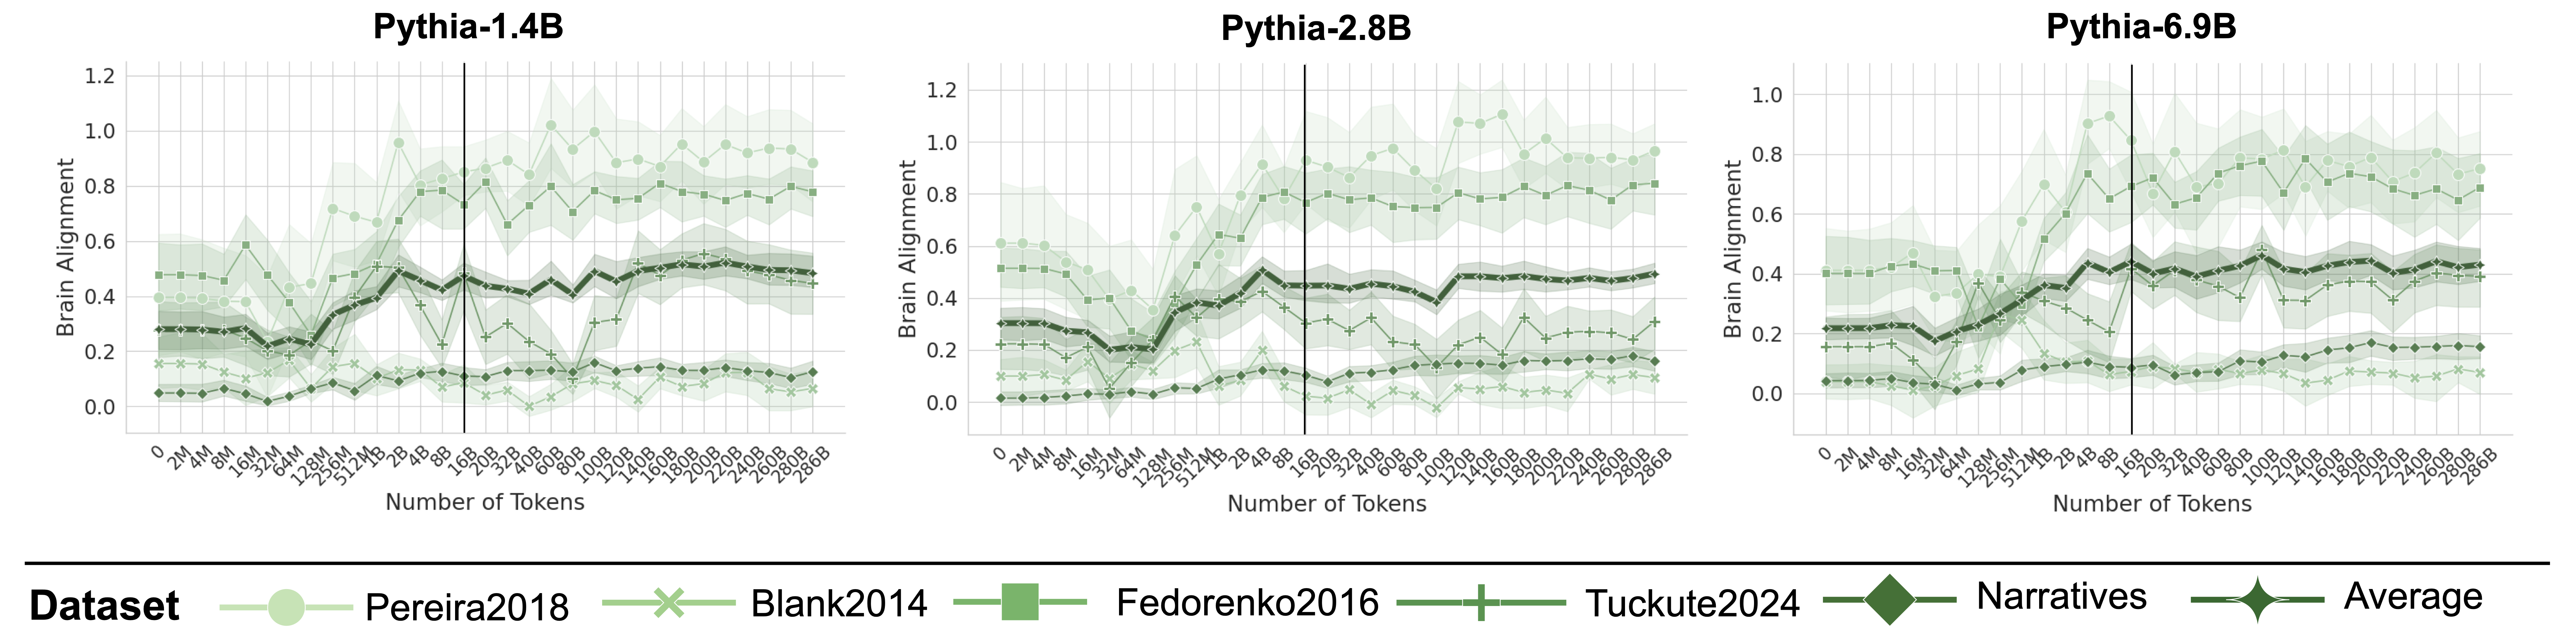
Three line graphs compare brain alignment metrics across different Pythia language model sizes (1.4B, 2.8B, 6.9B) against token counts. Each graph shows multiple datasets with shaded confidence intervals, suggesting variability in measurements.
### Components/Axes
- **X-axis**: "Number of Tokens" (0 to 266B, with markers at 2M, 4M, 8M, 16M, 32M, 64M, 128M, 256M, 512M, 1B, 2B, 4B, 8B, 16B, 32B, 64B, 128B, 256B)
- **Y-axis**: "Brain Alignment" (0.0 to 1.2, in 0.2 increments)
- **Legend**: Located at bottom, with:
- **Pereira2018**: Light green circles
- **Blank2014**: Light green crosses
- **Fedorenko2016**: Dark green squares
- **Tuckute2024**: Light green plus signs
- **Narratives**: Dark green diamonds
- **Average**: Dark green stars
### Detailed Analysis
1. **Pythia-1.4B**:
- Brain alignment starts near 0.2 at 2M tokens, peaks at ~0.6 at 128M tokens, then declines to ~0.4 at 266B tokens.
- Shaded regions (confidence intervals) widen significantly after 128M tokens.
2. **Pythia-2.8B**:
- Initial alignment ~0.3 at 2M tokens, rises to ~0.7 at 128M tokens, then stabilizes near 0.6 at 266B tokens.
- Confidence intervals remain narrower than Pythia-1.4B.
3. **Pythia-6.9B**:
- Starts at ~0.25 at 2M tokens, surges to ~0.9 at 128M tokens, then plateaus at ~0.7 at 266B tokens.
- Largest confidence intervals, especially between 128M and 256B tokens.
### Key Observations
- **Model Size Correlation**: Larger models (6.9B > 2.8B > 1.4B) show higher peak brain alignment, particularly at 128M tokens.
- **Dataset Variability**:
- **Fedorenko2016** (squares) consistently shows highest alignment across all models.
- **Pereira2018** (circles) and **Blank2014** (crosses) exhibit lower alignment values.
- **Tuckute2024** (plus signs) and **Narratives** (diamonds) fall between these extremes.
- **Token Threshold**: All models show a notable inflection point at ~128M tokens, where alignment sharply increases before plateauing.
### Interpretation
The data suggests that:
1. **Model Capacity Matters**: Larger Pythia models achieve higher brain alignment, likely due to improved contextual understanding.
2. **Dataset-Specific Performance**: Fedorenko2016 and Tuckute2024 datasets demonstrate stronger alignment, possibly reflecting better-suited training data or task design.
3. **Token Efficiency**: The 128M token threshold appears critical, where models transition from shallow to deeper processing.
4. **Uncertainty Patterns**: Wider confidence intervals in larger models (especially 6.9B) indicate greater variability in alignment measurements at scale.
The shaded regions highlight measurement uncertainty, with Pythia-6.9B showing the most variability, suggesting challenges in maintaining consistent alignment at extreme scales.