## Diagram: LLM-Driven Planning Process
### Overview
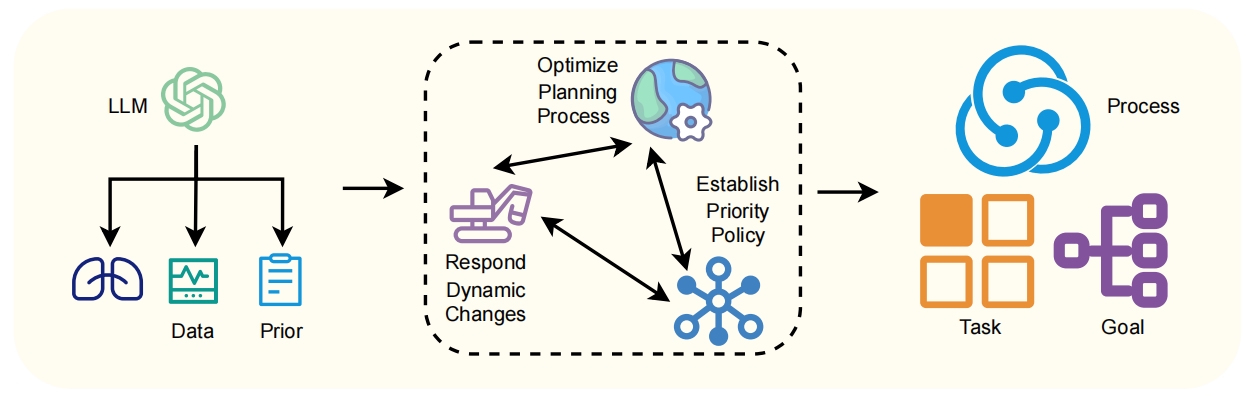
The image is a diagram illustrating a planning process driven by a Large Language Model (LLM). The diagram shows the LLM feeding into data and prior information, which then informs an iterative optimization loop. This loop involves optimizing the planning process, responding to dynamic changes, and establishing priority policies. The output of this loop leads to tasks and goals.
### Components/Axes
* **LLM:** Located at the top-left, represented by a green icon resembling the OpenAI logo.
* **Data:** Located below the LLM, represented by a green waveform icon.
* **Prior:** Located below the LLM, represented by a blue clipboard icon.
* **Optimize Planning Process:** Located within a dashed rounded rectangle, represented by a blue and green globe icon with a gear.
* **Respond Dynamic Changes:** Located within the dashed rounded rectangle, represented by a purple excavator icon.
* **Establish Priority Policy:** Located within the dashed rounded rectangle, represented by a blue molecule icon.
* **Process:** Located at the top-right, represented by a blue icon of three interconnected circles.
* **Task:** Located at the bottom-right, represented by an orange grid icon.
* **Goal:** Located at the bottom-right, represented by a purple tree-like icon.
### Detailed Analysis
* The LLM feeds into "Data" and "Prior" information via downward-pointing arrows.
* An arrow points from "Prior" to the dashed rounded rectangle.
* Inside the dashed rounded rectangle, double-headed arrows connect "Optimize Planning Process", "Respond Dynamic Changes", and "Establish Priority Policy", indicating an iterative loop.
* An arrow points from the dashed rounded rectangle to "Process".
* "Process" leads to "Task" and "Goal".
### Key Observations
* The diagram highlights the LLM's role in providing data and prior information to a dynamic planning process.
* The iterative loop within the dashed rounded rectangle suggests continuous refinement and adaptation.
* The final output is structured into tasks and goals, indicating a clear objective-driven approach.
### Interpretation
The diagram illustrates a system where an LLM provides the initial information for a planning process. This process is dynamic and iterative, allowing for continuous optimization and adaptation to changing circumstances. The ultimate goal is to generate actionable tasks and achieve specific goals. The diagram suggests a closed-loop system where the LLM's output is continuously refined based on feedback from the planning process. The use of an LLM allows for the incorporation of large amounts of data and prior knowledge, potentially leading to more effective and efficient planning.