## Flowchart: System Workflow for Process Optimization
### Overview
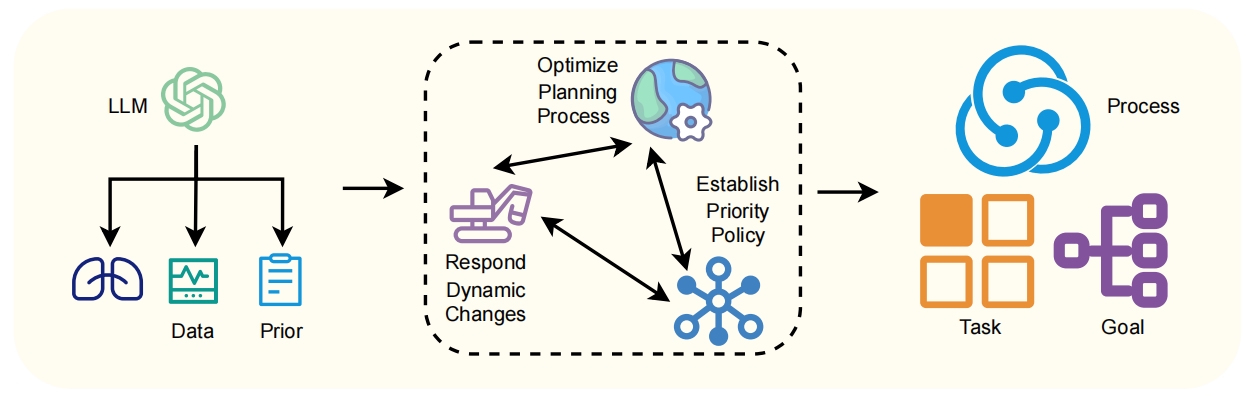
The diagram illustrates a multi-stage workflow for optimizing processes using a Large Language Model (LLM). It begins with input data and prior knowledge, progresses through planning and policy establishment, and concludes with task execution and goal achievement. Arrows indicate directional flow and interdependencies.
### Components/Axes
1. **Left Section (Input Stage)**
- **LLM**: Central node with a floral icon (top-left)
- **Data**: Lungs icon (blue, bottom-left)
- **Prior**: Document icon (blue, bottom-right)
- Arrows connect LLM to Data and Prior, indicating data/prior input.
2. **Middle Section (Planning & Policy)**
- **Dashed Box**: Contains three interconnected processes:
- **Optimize Planning Process**: Globe icon (top-center)
- **Establish Priority Policy**: Flower icon (top-right)
- **Respond Dynamic Changes**: Gear icon (bottom-left)
- Arrows form a triangular feedback loop between these components.
3. **Right Section (Execution Stage)**
- **Process**: Cogwheel icon (top-center)
- **Task**: Grid of four squares (bottom-left)
- **Goal**: Network diagram (bottom-right)
- Arrows connect the middle section to Process, Task, and Goal.
### Detailed Analysis
- **Input Stage**: LLM integrates Data (possibly sensor/biological data) and Prior (historical/predefined knowledge).
- **Planning & Policy**:
- Optimize Planning Process (global symbolism) interacts with Establish Priority Policy (hierarchical symbolism) and Respond Dynamic Changes (adaptive mechanisms).
- Feedback loops suggest iterative refinement.
- **Execution Stage**:
- Process (mechanical symbolism) leads to Task (structured execution) and Goal (systemic outcomes).
- No explicit numerical values; symbolic representation of workflow stages.
### Key Observations
- **Symbolic Representation**: Icons (lungs, globe, gear) abstractly represent data types, optimization scope, and adaptability.
- **Feedback Mechanism**: The triangular loop in the middle section emphasizes dynamic adjustment.
- **Hierarchical Flow**: Input → Planning → Execution structure suggests a top-down workflow.
### Interpretation
This diagram represents a closed-loop system where LLM-driven planning (informed by data and prior knowledge) adapts to dynamic changes through policy adjustments, ultimately executing tasks to achieve defined goals. The globe icon implies global optimization considerations, while the gear icon highlights responsiveness to real-time changes. The absence of numerical data suggests this is a conceptual workflow rather than a quantitative model. The feedback loop between planning and policy adjustment indicates an emphasis on iterative improvement in process optimization.