## Chart Type: Multiple Plots
### Overview
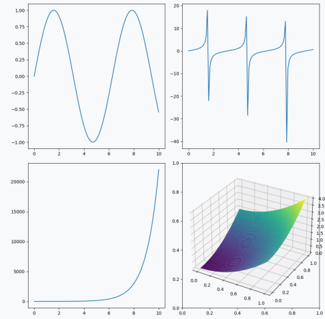
The image contains four plots arranged in a 2x2 grid. The plots showcase different mathematical functions. The top-left plot shows a sine wave, the top-right plot shows a tangent function, the bottom-left plot shows an exponential function, and the bottom-right plot shows a 3D surface plot.
### Components/Axes
**Top-Left Plot (Sine Wave):**
* X-axis: Ranges from 0 to 10.
* Y-axis: Ranges from -1 to 1.
**Top-Right Plot (Tangent Function):**
* X-axis: Ranges from 0 to 10.
* Y-axis: Ranges from approximately -40 to 20.
**Bottom-Left Plot (Exponential Function):**
* X-axis: Ranges from 0 to 10.
* Y-axis: Ranges from 0 to 20000.
**Bottom-Right Plot (3D Surface):**
* X-axis: Ranges from 0 to 1.
* Y-axis: Ranges from 0 to 1.
* Z-axis: Ranges from 0 to 4.
### Detailed Analysis
**Top-Left Plot (Sine Wave):**
* The sine wave starts at approximately y=0 at x=0.
* It reaches a peak of approximately y=1 around x=2.5.
* It crosses the x-axis (y=0) around x=5.
* It reaches a minimum of approximately y=-1 around x=7.5.
* It crosses the x-axis again around x=10.
**Top-Right Plot (Tangent Function):**
* The tangent function has vertical asymptotes.
* There appear to be asymptotes around x=1.5, x=4.75, x=7.8, and x=11.
* The function approaches positive and negative infinity near these asymptotes.
**Bottom-Left Plot (Exponential Function):**
* The exponential function starts near y=0 at x=0.
* It increases slowly at first, then rapidly increases as x approaches 10.
* At x=10, the function reaches a value of approximately y=20000.
**Bottom-Right Plot (3D Surface):**
* The surface plot shows a curved surface.
* The surface is lowest near the origin (x=0, y=0, z=0).
* The surface rises as x and y increase.
* The highest point of the surface is near x=1, y=1, with a z-value of approximately 4.
* The color gradient ranges from purple (low values) to green/yellow (high values).
### Key Observations
* The plots represent different types of mathematical functions: periodic (sine, tangent), exponential, and a 3D surface.
* The scales of the y-axes vary significantly between the plots, reflecting the different ranges of the functions.
* The tangent function exhibits vertical asymptotes, a characteristic feature of this function.
* The exponential function demonstrates rapid growth as x increases.
* The 3D surface plot shows a smooth, curved surface that increases in height as x and y increase.
### Interpretation
The image provides a visual representation of different mathematical functions and their behavior over a given range. The sine wave demonstrates periodic oscillation, the tangent function shows asymptotic behavior, the exponential function illustrates rapid growth, and the 3D surface plot visualizes a function of two variables. The plots are useful for understanding the characteristics and properties of these functions. The varying scales of the y-axes highlight the different magnitudes of the function values.