## Scatter Plot: Confidence vs. Target Length in Machine Learning
### Overview
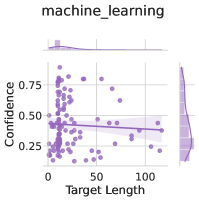
The image is a scatter plot titled "machine_learning" that visualizes the relationship between "Target Length" (x-axis) and "Confidence" (y-axis). A trend line and shaded confidence interval are overlaid on the data points, with a histogram on the right showing the distribution of confidence values. The legend is positioned in the top-right corner.
### Components/Axes
- **Title**: "machine_learning" (top-center).
- **X-axis**: "Target Length" (0 to 100, linear scale).
- **Y-axis**: "Confidence" (0.25 to 0.75, linear scale).
- **Legend**: Located in the top-right corner, labeled "Confidence Interval" with a purple color.
- **Histogram**: Right-aligned, showing the distribution of confidence values with bins.
### Detailed Analysis
- **Data Points**: Purple dots scattered across the plot, with higher density near the lower-left (low target length, low confidence) and upper-right (high target length, moderate confidence) regions.
- **Trend Line**: A dashed purple line showing a slight downward slope from left to right, indicating a weak negative correlation between target length and confidence.
- **Confidence Interval**: Shaded purple area around the trend line, narrowing as target length increases. The interval is widest at low target lengths (0–20) and narrowest at high target lengths (80–100).
- **Histogram**: Right histogram shows a unimodal distribution with a peak around 0.5 confidence. Most values cluster between 0.4 and 0.6, with fewer points below 0.3 and above 0.7.
### Key Observations
1. **Negative Correlation**: The trend line suggests that as target length increases, confidence slightly decreases, though the relationship is weak.
2. **Confidence Interval Narrowing**: The shaded area around the trend line becomes tighter at higher target lengths, implying greater certainty in predictions for longer targets.
3. **Confidence Distribution**: The histogram reveals that most confidence values are concentrated in the 0.4–0.6 range, with a peak at 0.5. Outliers exist at both extremes (e.g., 0.25 and 0.75).
### Interpretation
The data suggests that in this machine learning context, longer target lengths are associated with marginally lower confidence, but the confidence interval tightens, indicating more reliable predictions for longer targets. The majority of confidence values cluster around 0.5, suggesting the model performs consistently across most target lengths. However, the weak negative trend and presence of outliers (e.g., low confidence at short lengths) may indicate limitations in the model's ability to handle shorter targets effectively. The narrowing confidence interval at higher lengths implies improved model stability for longer sequences, which could be critical for applications requiring high reliability.