## Scatter Plot: Machine Learning Confidence vs. Target Length
### Overview
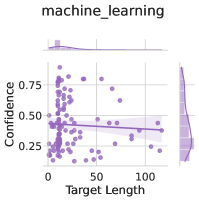
The image is a scatter plot titled "machine_learning" showing the relationship between "Confidence" (y-axis) and "Target Length" (x-axis). The plot includes a regression line with a shaded confidence interval. Histograms are displayed along the top and right margins, showing the distributions of Target Length and Confidence, respectively. The data points are colored in a light purple hue.
### Components/Axes
* **Title:** machine\_learning
* **X-axis:** Target Length
* Scale: 0 to approximately 100, with tick marks at intervals of 50.
* **Y-axis:** Confidence
* Scale: 0 to 0.75, with tick marks at intervals of 0.25.
* **Data Points:** Light purple dots representing individual data points.
* **Regression Line:** A light purple line showing the linear regression fit to the data.
* **Confidence Interval:** A shaded light purple region around the regression line, representing the confidence interval.
* **Marginal Histograms:** Histograms along the top (Target Length) and right (Confidence) margins, showing the distribution of each variable.
### Detailed Analysis
* **Target Length Distribution:** The histogram along the top shows that most data points have a Target Length between 0 and 20.
* **Confidence Distribution:** The histogram on the right shows a concentration of data points around 0.25 and 0.5 confidence levels.
* **Scatter Plot:** The scatter plot shows a cluster of points with low Target Length (0-20) and varying Confidence levels (0.25-0.75). As Target Length increases, the Confidence values appear to spread out more.
* **Regression Line:** The regression line has a slight negative slope, suggesting a weak negative correlation between Target Length and Confidence.
* **Data Points:**
* At Target Length = 0, Confidence ranges from approximately 0.1 to 0.75.
* At Target Length = 20, Confidence ranges from approximately 0.2 to 0.8.
* At Target Length = 50, Confidence ranges from approximately 0.3 to 0.75.
* At Target Length = 100, Confidence ranges from approximately 0.3 to 0.5.
### Key Observations
* Most data points are clustered at low Target Length values.
* There is a slight negative correlation between Target Length and Confidence, as indicated by the slightly downward-sloping regression line.
* The confidence interval around the regression line is relatively wide, suggesting a weak relationship between the two variables.
### Interpretation
The scatter plot suggests that there is a weak negative relationship between the Target Length and Confidence in the machine learning model. The clustering of data points at low Target Length values indicates that the model may be more reliable for shorter targets. The wide confidence interval suggests that the relationship is not strong, and other factors may be influencing the Confidence levels. The model's confidence tends to decrease slightly as the target length increases, but the effect is not pronounced.