## Chart: HMC Step vs. Value for Different 'd' Values
### Overview
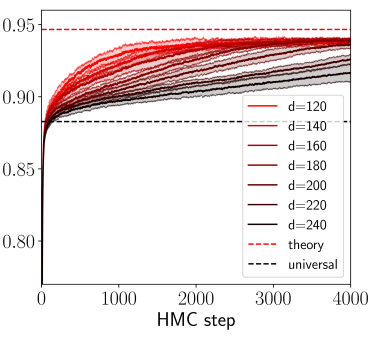
The image is a line chart showing the relationship between the HMC (Hamiltonian Monte Carlo) step and a value (presumably a performance metric) for different values of 'd'. The chart includes data for d=120, 140, 160, 180, 200, 220, and 240, along with theoretical and universal baselines.
### Components/Axes
* **X-axis:** HMC step, ranging from 0 to 4000.
* **Y-axis:** Value, ranging from 0.80 to 0.95.
* **Legend:** Located in the center-right of the chart, it identifies each line by its 'd' value (120 to 240), as well as "theory" and "universal" baselines.
* d=120: Red
* d=140: Dark Red
* d=160: Brownish-Red
* d=180: Dark Brown
* d=200: Dark Gray
* d=220: Gray
* d=240: Black
* theory: Dashed Red
* universal: Dashed Black
### Detailed Analysis
* **d=120 (Red):** Starts at approximately 0.80 and increases rapidly to about 0.92 by HMC step 500, then gradually increases to approximately 0.94 by HMC step 4000.
* **d=140 (Dark Red):** Similar to d=120, starts at approximately 0.80, increases rapidly to about 0.91 by HMC step 500, then gradually increases to approximately 0.93 by HMC step 4000.
* **d=160 (Brownish-Red):** Starts at approximately 0.80, increases rapidly to about 0.90 by HMC step 500, then gradually increases to approximately 0.92 by HMC step 4000.
* **d=180 (Dark Brown):** Starts at approximately 0.80, increases rapidly to about 0.89 by HMC step 500, then gradually increases to approximately 0.91 by HMC step 4000.
* **d=200 (Dark Gray):** Starts at approximately 0.80, increases rapidly to about 0.88 by HMC step 500, then gradually increases to approximately 0.90 by HMC step 4000.
* **d=220 (Gray):** Starts at approximately 0.80, increases rapidly to about 0.87 by HMC step 500, then gradually increases to approximately 0.89 by HMC step 4000.
* **d=240 (Black):** Starts at approximately 0.80, increases rapidly to about 0.86 by HMC step 500, then gradually increases to approximately 0.88 by HMC step 4000.
* **Theory (Dashed Red):** A horizontal dashed red line at approximately 0.95.
* **Universal (Dashed Black):** A horizontal dashed black line at approximately 0.88.
### Key Observations
* All 'd' values start at approximately the same value (0.80) and increase rapidly in the initial HMC steps.
* As 'd' increases, the final value reached by HMC step 4000 decreases.
* The "theory" baseline is higher than all 'd' values, while the "universal" baseline is lower than all 'd' values.
* The rate of increase slows down significantly after approximately 500 HMC steps for all 'd' values.
### Interpretation
The chart suggests that the value being measured is influenced by the 'd' parameter. Lower values of 'd' result in higher final values after a certain number of HMC steps. The theoretical baseline represents an upper limit, while the universal baseline represents a lower limit. The HMC process appears to converge relatively quickly in the initial steps, with diminishing returns as the number of steps increases. The 'd' parameter seems to control the upper bound of the value achieved by the HMC process.