\n
## Line Chart: HMC Step vs. Acceptance Rate
### Overview
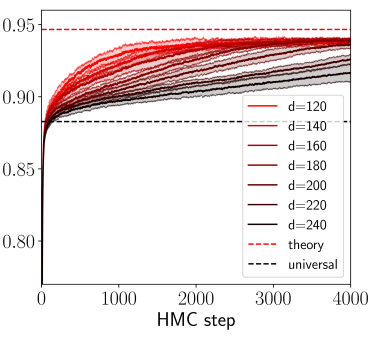
The image presents a line chart illustrating the acceptance rate of Hamiltonian Monte Carlo (HMC) steps as a function of the HMC step number. Multiple lines represent different values of a parameter 'd', alongside theoretical and universal acceptance rate benchmarks.
### Components/Axes
* **X-axis:** "HMC step" ranging from 0 to 4000.
* **Y-axis:** Acceptance Rate, ranging from 0.80 to 0.96.
* **Legend:** Located in the bottom-right corner, listing the following lines:
* d = 120 (Red)
* d = 140 (Light Red)
* d = 160 (Medium Red)
* d = 180 (Dark Red)
* d = 200 (Brown)
* d = 220 (Gray)
* d = 240 (Dark Gray)
* theory (Red Dashed)
* universal (Black Dashed)
### Detailed Analysis
The chart displays several lines representing the acceptance rate over HMC steps for different values of 'd'.
* **d = 120 (Red):** The line starts at approximately 0.82 at HMC step 0, rapidly increases to around 0.94 by HMC step 500, and then plateaus, fluctuating around 0.94-0.95 for the remainder of the steps.
* **d = 140 (Light Red):** Starts at approximately 0.83, increases to around 0.93 by HMC step 500, and plateaus around 0.93-0.94.
* **d = 160 (Medium Red):** Starts at approximately 0.84, increases to around 0.92 by HMC step 500, and plateaus around 0.92-0.93.
* **d = 180 (Dark Red):** Starts at approximately 0.85, increases to around 0.91 by HMC step 500, and plateaus around 0.91-0.92.
* **d = 200 (Brown):** Starts at approximately 0.86, increases to around 0.90 by HMC step 500, and plateaus around 0.90-0.91.
* **d = 220 (Gray):** Starts at approximately 0.87, increases to around 0.89 by HMC step 500, and plateaus around 0.89-0.90.
* **d = 240 (Dark Gray):** Starts at approximately 0.88, increases to around 0.88 by HMC step 500, and plateaus around 0.88-0.89.
* **theory (Red Dashed):** A horizontal line at approximately 0.95.
* **universal (Black Dashed):** A horizontal line at approximately 0.90.
All lines for different 'd' values exhibit a similar trend: a rapid increase in acceptance rate during the initial HMC steps (up to approximately 500), followed by a plateau. As 'd' increases, the plateau acceptance rate decreases.
### Key Observations
* The acceptance rates for lower values of 'd' (120-180) approach the theoretical acceptance rate of 0.95.
* As 'd' increases, the acceptance rate decreases and converges towards the universal acceptance rate of 0.90.
* The initial increase in acceptance rate suggests a burn-in period where the HMC algorithm is adapting to the parameter space.
### Interpretation
The chart demonstrates the relationship between the parameter 'd' and the acceptance rate of HMC. The acceptance rate is a crucial metric for assessing the efficiency of HMC. A higher acceptance rate generally indicates better exploration of the parameter space, but it can also be indicative of a smaller step size. The theoretical acceptance rate represents an optimal value for efficient sampling. The universal acceptance rate is a lower bound, and values below this may indicate poor mixing.
The observed trend suggests that as 'd' increases, the HMC algorithm becomes less efficient, potentially due to larger step sizes or a more complex parameter space. The convergence of the lines towards the universal acceptance rate indicates a limit to the efficiency of HMC for higher values of 'd'. This information is valuable for tuning the HMC algorithm and selecting appropriate values for 'd' to achieve a balance between exploration and efficiency.