## Line Chart: Convergence of HMC Steps Across Dimensions
### Overview
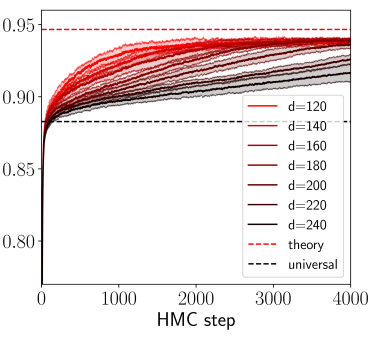
The chart illustrates the convergence behavior of Hamiltonian Monte Carlo (HMC) steps across varying dimensions (`d`). Multiple data series represent different dimension values, showing how a metric (likely acceptance rate or convergence quality) evolves over HMC steps. Two theoretical benchmarks ("theory" and "universal") are plotted as dashed lines for comparison.
### Components/Axes
- **X-axis**: "HMC step" (0 to 4000), representing the number of HMC iterations.
- **Y-axis**: A metric (unitless, 0.80–0.95), likely acceptance rate or convergence quality.
- **Legend**:
- Solid lines: Dimension values (`d=120` to `d=240` in increments of 20).
- Dashed lines:
- Red: "theory" (upper bound at ~0.95).
- Black: "universal" (lower bound at ~0.90).
- **Line Colors**:
- Red shades for lower `d` values (e.g., `d=120` is bright red).
- Darker shades (black) for higher `d` values (e.g., `d=240` is nearly black).
### Detailed Analysis
- **Initial Behavior**: All lines start near 0.80 at HMC step 0, indicating a uniform initial state.
- **Rise Phase**: Lines sharply increase between 0 and ~1000 steps, with higher `d` values (e.g., `d=240`) rising faster.
- **Plateau Phase**: After ~1000 steps, lines flatten, approaching asymptotic values:
- `d=120`: ~0.85 (below "universal" line).
- `d=240`: ~0.94 (near "theory" line).
- **Asymptotic Trends**:
- Higher `d` values (e.g., `d=200`, `d=240`) approach the "theory" line (~0.95).
- Lower `d` values (e.g., `d=120`, `d=140`) plateau near or below the "universal" line (~0.90).
### Key Observations
1. **Dimensionality Impact**: Higher `d` values achieve better convergence, with `d=240` nearly reaching the theoretical maximum.
2. **Theoretical vs. Universal**:
- "Theory" (~0.95) acts as an upper performance ceiling.
- "Universal" (~0.90) represents a lower benchmark, exceeded only by higher `d` values.
3. **Convergence Speed**: Lines for `d ≥ 200` converge faster and to higher values than lower `d` values.
### Interpretation
The chart demonstrates that increasing the dimension `d` improves HMC performance, as measured by the metric. Higher dimensions allow the algorithm to approach the theoretical optimum more closely, while lower dimensions remain constrained by a universal performance floor. The "universal" line may represent a baseline achievable across all dimensions, whereas the "theory" line reflects an idealized limit. This suggests that HMC efficiency is sensitive to dimensionality, with practical applications benefiting from higher `d` values when computational resources permit.