## Histogram: Reward Score Density Comparison
### Overview
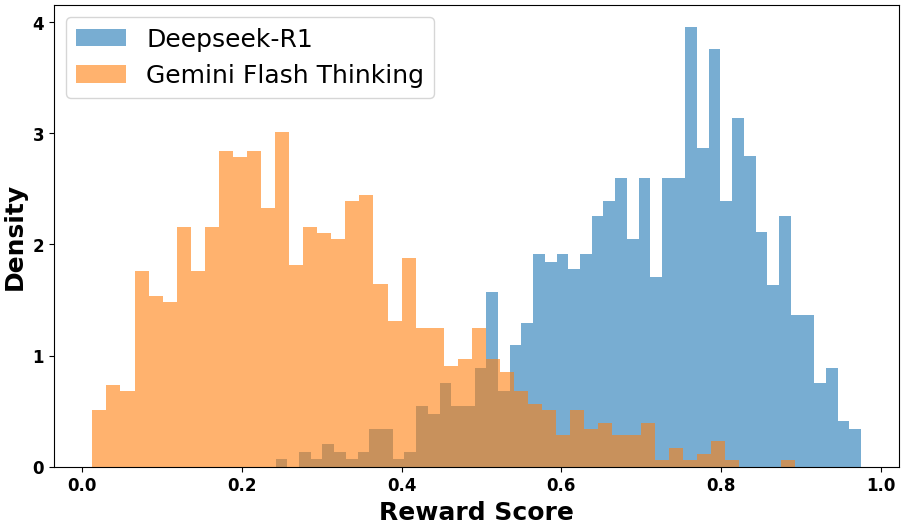
The image is a histogram comparing the density distribution of reward scores for two models: Deepseek-R1 and Gemini Flash Thinking. The x-axis represents the reward score, ranging from 0.0 to 1.0. The y-axis represents the density. The histogram shows the frequency of different reward scores for each model.
### Components/Axes
* **X-axis:** Reward Score, ranging from 0.0 to 1.0, with markers at 0.0, 0.2, 0.4, 0.6, 0.8, and 1.0.
* **Y-axis:** Density, ranging from 0 to 4, with markers at 0, 1, 2, 3, and 4.
* **Legend (top-left):**
* Blue: Deepseek-R1
* Orange: Gemini Flash Thinking
### Detailed Analysis
* **Deepseek-R1 (Blue):** The distribution is centered around a reward score of approximately 0.8. The density increases from 0.6 to a peak around 0.8, then decreases towards 1.0.
* Density at Reward Score 0.6: ~0.5
* Peak Density at Reward Score 0.8: ~3.5
* Density at Reward Score 1.0: ~0.1
* **Gemini Flash Thinking (Orange):** The distribution is centered around a reward score of approximately 0.2. The density increases from 0.0 to a peak around 0.2, then decreases towards 0.4.
* Density at Reward Score 0.0: ~0.0
* Peak Density at Reward Score 0.2: ~2.8
* Density at Reward Score 0.4: ~0.5
### Key Observations
* The two distributions are clearly separated, indicating a significant difference in reward scores between the two models.
* Deepseek-R1 consistently achieves higher reward scores compared to Gemini Flash Thinking.
* The distributions are unimodal, with a single peak for each model.
### Interpretation
The histogram demonstrates that Deepseek-R1 generally achieves higher reward scores than Gemini Flash Thinking. The distinct separation of the distributions suggests a substantial performance difference between the two models. Deepseek-R1's peak density around 0.8 indicates that it frequently achieves high reward scores, while Gemini Flash Thinking's peak density around 0.2 suggests that it typically achieves lower reward scores. This visualization provides a clear comparison of the performance characteristics of the two models based on their reward score distributions.