\n
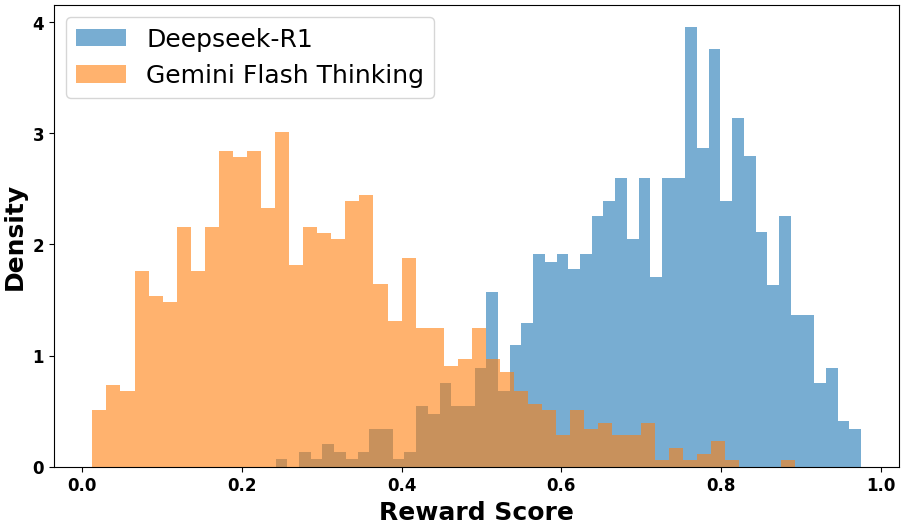
## Histogram: Reward Score Distribution
### Overview
This image presents a histogram comparing the distribution of "Reward Scores" for two models: "Deepseek-R1" and "Gemini Flash Thinking". The histogram displays the density of scores across a range from 0.0 to 1.0.
### Components/Axes
* **X-axis:** "Reward Score" ranging from 0.0 to 1.0.
* **Y-axis:** "Density", ranging from 0.0 to approximately 4.0.
* **Legend:** Located at the top-right corner of the chart.
* "Deepseek-R1" - represented by a blue color.
* "Gemini Flash Thinking" - represented by an orange color.
### Detailed Analysis
The chart shows two overlapping histograms.
**Deepseek-R1 (Blue):**
The distribution appears to be bimodal, with a peak around 0.75-0.85 and a smaller peak near 0.95. The density increases from approximately 0.5 at a reward score of 0.0, reaches a maximum of approximately 3.5 at a reward score of 0.8, and then decreases to approximately 0.5 at a reward score of 1.0.
**Gemini Flash Thinking (Orange):**
The distribution is unimodal, peaking around 0.2-0.4. The density is highest at approximately 3.2 at a reward score of 0.2, and then gradually decreases to approximately 0.2 at a reward score of 1.0. There is a small secondary peak around 0.6.
Here's an approximate breakdown of density values at specific reward scores:
| Reward Score | Deepseek-R1 Density | Gemini Flash Thinking Density |
|--------------|----------------------|-------------------------------|
| 0.0 | ~0.5 | ~2.8 |
| 0.2 | ~1.0 | ~3.2 |
| 0.4 | ~1.5 | ~2.0 |
| 0.6 | ~2.5 | ~1.0 |
| 0.8 | ~3.5 | ~0.5 |
| 1.0 | ~0.5 | ~0.2 |
### Key Observations
* Deepseek-R1 generally achieves higher reward scores than Gemini Flash Thinking.
* The distribution of reward scores for Deepseek-R1 is more spread out, indicating greater variability in performance.
* Gemini Flash Thinking's distribution is more concentrated in the lower reward score range.
* There is some overlap between the two distributions, particularly in the 0.6-0.8 range.
### Interpretation
The data suggests that Deepseek-R1 consistently outperforms Gemini Flash Thinking in terms of reward scores. The bimodal distribution of Deepseek-R1 could indicate the presence of two distinct modes of operation or two different types of tasks where the model excels. Gemini Flash Thinking, on the other hand, appears to be more consistently performing at a lower level. The overlap in the distributions suggests that there are instances where Gemini Flash Thinking can achieve comparable scores to Deepseek-R1, but these are less frequent. The difference in the spread of the distributions could indicate that Deepseek-R1 is more sensitive to the specific input or task, while Gemini Flash Thinking is more robust but less capable of achieving very high scores. This data is likely derived from a reinforcement learning or reward-based evaluation framework, where the "Reward Score" represents the quality or desirability of the model's output.