## Histogram: Reward Score Density Comparison
### Overview
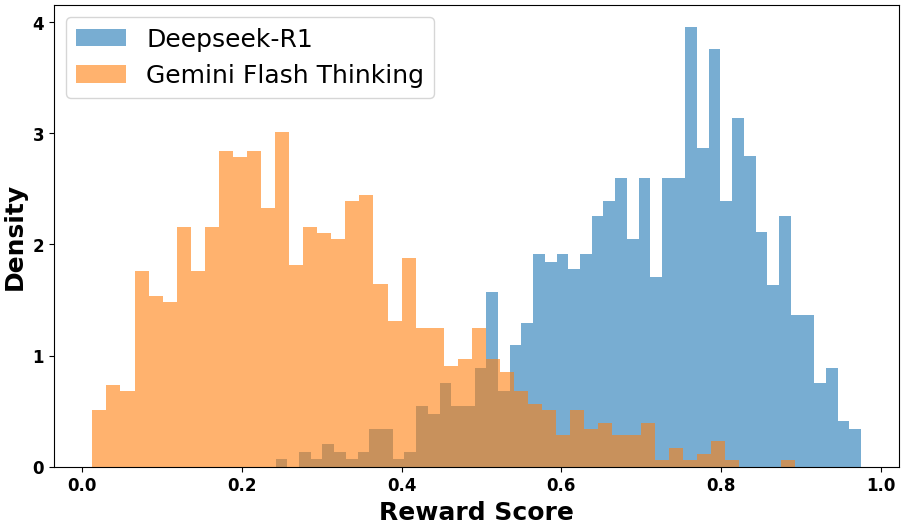
The image is a histogram comparing the density distributions of "Reward Score" for two different models or systems: "Deepseek-R1" and "Gemini Flash Thinking". The chart visualizes how frequently different reward scores occur for each entity.
### Components/Axes
* **Chart Type:** Histogram (overlapping, semi-transparent bars).
* **X-Axis:**
* **Label:** "Reward Score"
* **Scale:** Linear, ranging from 0.0 to 1.0.
* **Major Tick Marks:** 0.0, 0.2, 0.4, 0.6, 0.8, 1.0.
* **Y-Axis:**
* **Label:** "Density"
* **Scale:** Linear, ranging from 0 to 4.
* **Major Tick Marks:** 0, 1, 2, 3, 4.
* **Legend:**
* **Position:** Top-left corner of the plot area.
* **Entry 1:** A blue square labeled "Deepseek-R1".
* **Entry 2:** An orange square labeled "Gemini Flash Thinking".
### Detailed Analysis
The chart displays two distinct, overlapping distributions.
1. **Deepseek-R1 (Blue Distribution):**
* **Trend:** The distribution is heavily right-skewed, with the vast majority of density concentrated between reward scores of approximately 0.55 and 0.95.
* **Key Data Points/Density:**
* The distribution begins with very low density around 0.35.
* Density rises sharply after 0.55.
* The primary peak is located between 0.75 and 0.85, where the density reaches its maximum value of approximately 3.9 (just below the 4.0 mark).
* A secondary, slightly lower peak is visible around 0.80-0.82.
* Density falls off sharply after 0.90, approaching zero near 1.0.
2. **Gemini Flash Thinking (Orange Distribution):**
* **Trend:** The distribution is left-skewed, with the majority of density concentrated between reward scores of approximately 0.05 and 0.50.
* **Key Data Points/Density:**
* The distribution starts with low density near 0.0.
* It rises quickly, forming a broad, multi-modal plateau.
* The highest density region is between 0.15 and 0.30, with multiple local peaks. The maximum density in this range is approximately 3.0.
* Density gradually declines from 0.30 onwards, with a notable smaller peak around 0.40.
* The distribution has a long, low-density tail extending to the right, overlapping with the blue distribution. It becomes negligible after approximately 0.85.
3. **Overlap Region:**
* There is a significant area of overlap between the two distributions, roughly from reward scores of 0.35 to 0.70.
* In this region, the orange bars (Gemini) are generally lower than the rising blue bars (Deepseek). The combined color appears brownish.
* The overlap indicates that both models can produce reward scores in this mid-range, though with different frequencies.
### Key Observations
* **Clear Separation of Peaks:** The central tendency of the two distributions is distinctly separated. Deepseek-R1's scores cluster around ~0.8, while Gemini Flash Thinking's scores cluster around ~0.2.
* **Difference in Spread:** The Gemini Flash Thinking distribution appears wider and more spread out across the lower score range, while the Deepseek-R1 distribution is more tightly concentrated in the high-score range.
* **Asymmetry:** Both distributions are asymmetric. Deepseek-R1 has a sharp drop-off on the high-score side, and Gemini Flash Thinking has a long tail on the high-score side.
* **Maximum Density:** The highest single density value observed is for Deepseek-R1 (~3.9), which is higher than the peak density for Gemini Flash Thinking (~3.0).
### Interpretation
This histogram suggests a fundamental difference in the performance or output characteristics of the two models as measured by the "Reward Score" metric.
* **Performance Implication:** The data strongly indicates that **Deepseek-R1 consistently achieves higher reward scores** than Gemini Flash Thinking. Its distribution is shifted significantly to the right on the x-axis.
* **Model Behavior:** The tight clustering of Deepseek-R1's scores suggests more consistent and predictable high performance on the task generating these rewards. In contrast, Gemini Flash Thinking's wider, left-skewed distribution indicates more variable performance, with a tendency toward lower scores but with occasional instances of mid-to-high scores (the overlap region).
* **Potential Outliers:** The long right tail of the Gemini Flash Thinking distribution (scores > 0.6) could represent outlier cases where this model performs exceptionally well, matching the typical performance range of Deepseek-R1.
* **Underlying Cause:** The separation could be due to differences in model architecture, training data, optimization objectives, or the specific "thinking" process referenced in the name "Gemini Flash Thinking." The chart visualizes the outcome of these differences in terms of the reward signal.