## Bar Chart: Evaluation on Verification and Correction (Base Model: Qwen2-7B-Instruct)
### Overview
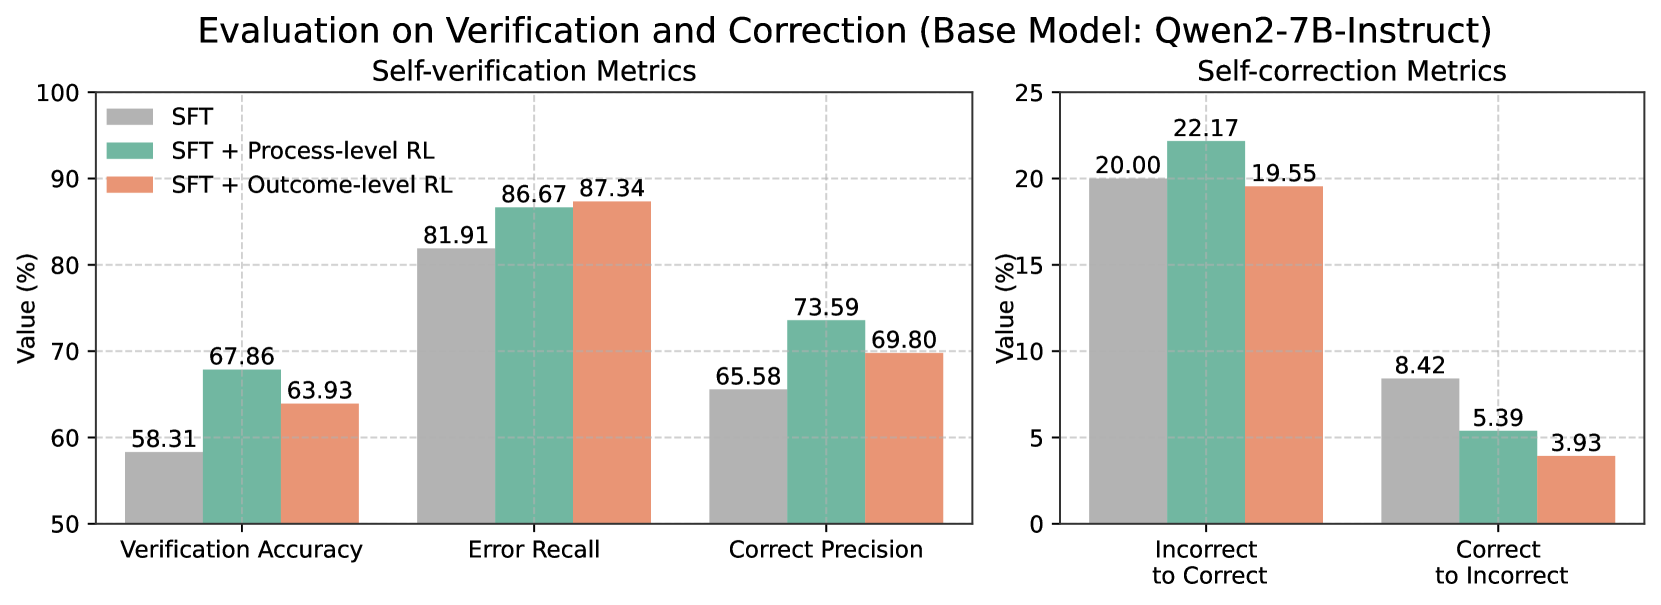
The image presents two bar charts comparing the performance of different models (SFT, SFT + Process-level RL, and SFT + Outcome-level RL) on self-verification and self-correction metrics. The left chart focuses on self-verification, showing Verification Accuracy, Error Recall, and Correct Precision. The right chart focuses on self-correction, showing Incorrect to Correct and Correct to Incorrect ratios.
### Components/Axes
**Overall Title:** Evaluation on Verification and Correction (Base Model: Qwen2-7B-Instruct)
**Left Chart:**
* **Title:** Self-verification Metrics
* **Y-axis:** Value (%)
* Scale: 50 to 100, incrementing by 10.
* **X-axis:**
* Verification Accuracy
* Error Recall
* Correct Precision
* **Legend:** Located in the top-left corner.
* SFT (Gray)
* SFT + Process-level RL (Teal)
* SFT + Outcome-level RL (Salmon)
**Right Chart:**
* **Title:** Self-correction Metrics
* **Y-axis:** Value (%)
* Scale: 0 to 25, incrementing by 5.
* **X-axis:**
* Incorrect to Correct
* Correct to Incorrect
* **Legend:** (Same as left chart, located in the top-left corner of the left chart)
* SFT (Gray)
* SFT + Process-level RL (Teal)
* SFT + Outcome-level RL (Salmon)
### Detailed Analysis
**Left Chart (Self-verification Metrics):**
* **Verification Accuracy:**
* SFT (Gray): 58.31%
* SFT + Process-level RL (Teal): 67.86%
* SFT + Outcome-level RL (Salmon): 63.93%
* Trend: SFT + Process-level RL performs best, followed by SFT + Outcome-level RL, and then SFT.
* **Error Recall:**
* SFT (Gray): 81.91%
* SFT + Process-level RL (Teal): 86.67%
* SFT + Outcome-level RL (Salmon): 87.34%
* Trend: SFT + Outcome-level RL performs best, closely followed by SFT + Process-level RL, and then SFT.
* **Correct Precision:**
* SFT (Gray): 65.58%
* SFT + Process-level RL (Teal): 73.59%
* SFT + Outcome-level RL (Salmon): 69.80%
* Trend: SFT + Process-level RL performs best, followed by SFT + Outcome-level RL, and then SFT.
**Right Chart (Self-correction Metrics):**
* **Incorrect to Correct:**
* SFT (Gray): 20.00%
* SFT + Process-level RL (Teal): 22.17%
* SFT + Outcome-level RL (Salmon): 19.55%
* Trend: SFT + Process-level RL performs best, followed by SFT, and then SFT + Outcome-level RL.
* **Correct to Incorrect:**
* SFT (Gray): 8.42%
* SFT + Process-level RL (Teal): 5.39%
* SFT + Outcome-level RL (Salmon): 3.93%
* Trend: SFT performs worst, followed by SFT + Process-level RL, and then SFT + Outcome-level RL.
### Key Observations
* For self-verification metrics, SFT + Process-level RL and SFT + Outcome-level RL generally outperform the base SFT model.
* For self-correction metrics, SFT + Process-level RL shows the highest rate of correcting incorrect answers.
* SFT + Outcome-level RL has the lowest rate of correct answers becoming incorrect.
### Interpretation
The charts suggest that incorporating reinforcement learning (RL), particularly process-level RL, enhances the performance of the Qwen2-7B-Instruct model in both self-verification and self-correction tasks. Process-level RL seems to be more effective at improving the model's ability to correct its mistakes, while outcome-level RL excels at maintaining the correctness of already correct answers. The base SFT model consistently underperforms compared to the RL-enhanced models, indicating the value of RL in improving model reliability and accuracy.