\n
## Bar Charts: Evaluation on Verification and Correction
### Overview
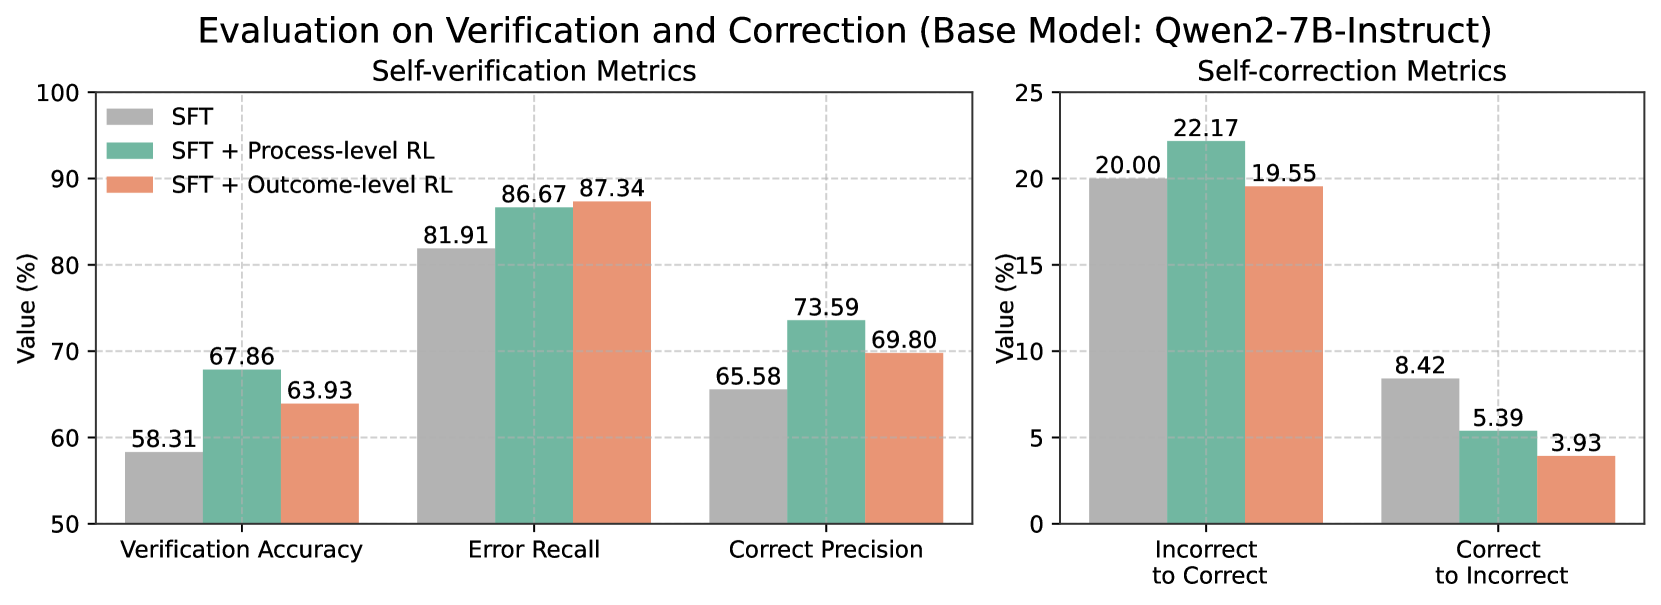
The image presents two sets of bar charts comparing the performance of a base model (Qwen2-7B-Instruct) with different training approaches: Supervised Fine-Tuning (SFT), SFT + Process-level Reinforcement Learning (RL), and SFT + Outcome-level RL. The left chart focuses on "Self-verification Metrics," while the right chart focuses on "Self-correction Metrics." Both charts display values as percentages.
### Components/Axes
* **Title:** "Evaluation on Verification and Correction (Base Model: Qwen2-7B-Instruct)" - positioned at the top-center of the image.
* **Left Chart Title:** "Self-verification Metrics" - positioned above the left chart.
* **Right Chart Title:** "Self-correction Metrics" - positioned above the right chart.
* **Y-axis Label (Both Charts):** "Value (%)" - positioned on the left side of both charts. The scale ranges from 50 to 100 for the left chart and from 0 to 25 for the right chart.
* **X-axis Labels (Left Chart):** "Verification Accuracy", "Error Recall", "Correct Precision" - positioned along the bottom of the left chart.
* **X-axis Labels (Right Chart):** "Incorrect to Correct", "Correct to Incorrect" - positioned along the bottom of the right chart.
* **Legend (Top-Left of Left Chart):**
* SFT (Blue)
* SFT + Process-level RL (Green)
* SFT + Outcome-level RL (Red)
### Detailed Analysis or Content Details
**Left Chart: Self-verification Metrics**
* **Verification Accuracy:**
* SFT: Approximately 58.31%
* SFT + Process-level RL: Approximately 67.86%
* SFT + Outcome-level RL: Approximately 63.93%
* Trend: The SFT + Process-level RL shows the highest value, indicating improved verification accuracy.
* **Error Recall:**
* SFT: Approximately 81.91%
* SFT + Process-level RL: Approximately 86.67%
* SFT + Outcome-level RL: Approximately 87.34%
* Trend: SFT + Outcome-level RL shows the highest value, indicating improved error recall.
* **Correct Precision:**
* SFT: Approximately 65.58%
* SFT + Process-level RL: Approximately 73.59%
* SFT + Outcome-level RL: Approximately 69.80%
* Trend: SFT + Process-level RL shows the highest value, indicating improved correct precision.
**Right Chart: Self-correction Metrics**
* **Incorrect to Correct:**
* SFT: Approximately 20.00%
* SFT + Process-level RL: Approximately 22.17%
* SFT + Outcome-level RL: Approximately 19.55%
* Trend: SFT + Process-level RL shows the highest value, indicating improved ability to correct incorrect statements.
* **Correct to Incorrect:**
* SFT: Approximately 8.42%
* SFT + Process-level RL: Approximately 5.39%
* SFT + Outcome-level RL: Approximately 3.93%
* Trend: SFT + Outcome-level RL shows the lowest value, indicating improved ability to avoid incorrectly altering correct statements.
### Key Observations
* In the Self-verification Metrics chart, SFT + Process-level RL consistently performs well in Verification Accuracy and Correct Precision, while SFT + Outcome-level RL excels in Error Recall.
* In the Self-correction Metrics chart, SFT + Process-level RL shows the highest value for Incorrect to Correct, while SFT + Outcome-level RL shows the lowest value for Correct to Incorrect.
* The addition of Reinforcement Learning (both process and outcome level) consistently improves performance over the base SFT model across all metrics.
### Interpretation
The data suggests that incorporating Reinforcement Learning into the training process of the Qwen2-7B-Instruct model significantly enhances both its self-verification and self-correction capabilities. The choice between Process-level RL and Outcome-level RL appears to depend on the specific metric being optimized. Process-level RL seems to be more effective at improving accuracy and precision, while Outcome-level RL is better at minimizing the introduction of errors during correction. The charts demonstrate a clear trade-off between these two aspects of performance. The model's ability to both verify its own outputs and correct errors is crucial for building reliable and trustworthy AI systems. The consistent improvement across all metrics with the addition of RL highlights the effectiveness of this technique for enhancing model performance.