## Bar Charts: Self-verification and Self-correction Metrics (Base Model: Qwen2-7B-Instruct)
### Overview
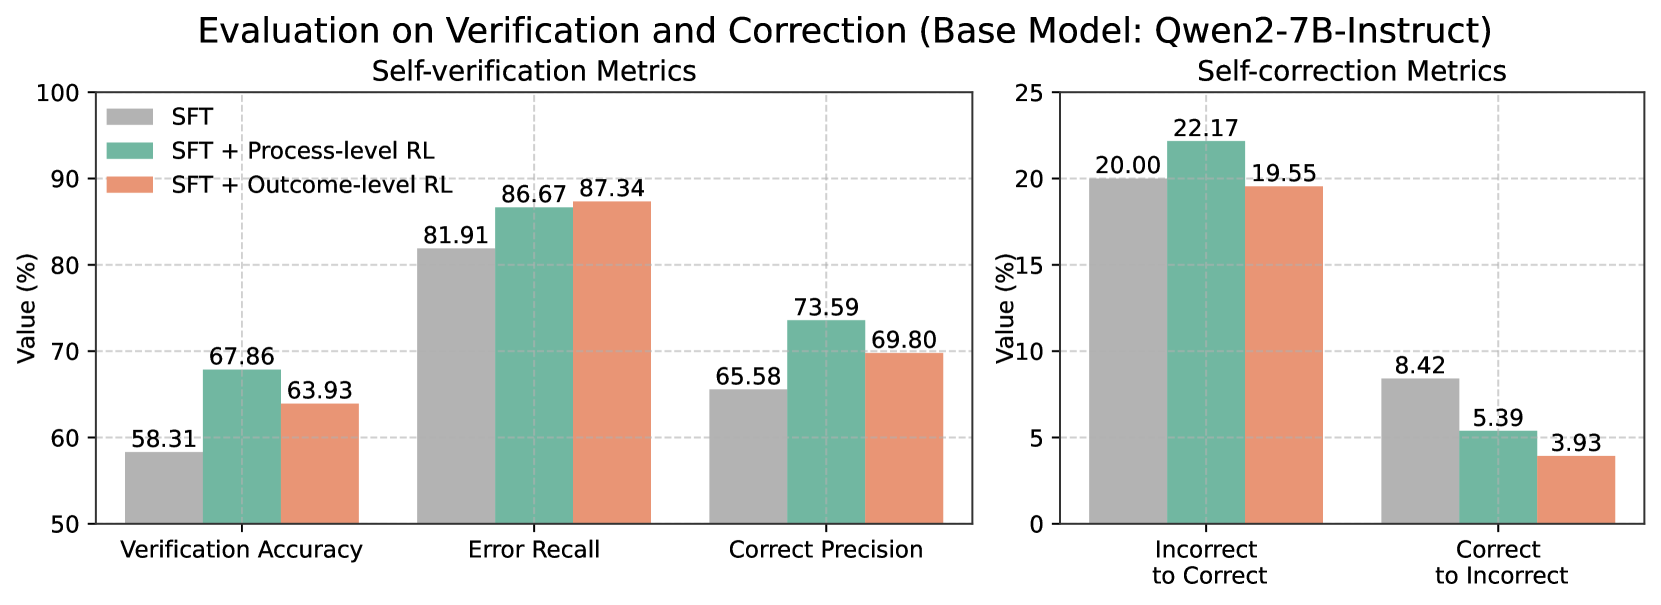
The image contains two side-by-side bar charts comparing performance metrics for a base model (Qwen2-7B-Instruct) under three training conditions:
1. **SFT** (Standard Fine-Tuning)
2. **SFT + Process-level RL** (Reinforcement Learning)
3. **SFT + Outcome-level RL**
The left chart focuses on **Self-verification Metrics** (Verification Accuracy, Error Recall, Correct Precision), while the right chart evaluates **Self-correction Metrics** (Incorrect to Correct, Correct to Incorrect). All values are expressed as percentages.
---
### Components/Axes
#### Left Chart (Self-verification Metrics)
- **X-axis**:
- Verification Accuracy
- Error Recall
- Correct Precision
- **Y-axis**: Value (%) from 50 to 100.
- **Legend**:
- **Gray**: SFT
- **Teal**: SFT + Process-level RL
- **Orange**: SFT + Outcome-level RL
#### Right Chart (Self-correction Metrics)
- **X-axis**:
- Incorrect to Correct
- Correct to Incorrect
- **Y-axis**: Value (%) from 0 to 25.
- **Legend**: Same color coding as the left chart.
---
### Detailed Analysis
#### Left Chart (Self-verification Metrics)
1. **Verification Accuracy**:
- SFT: 58.31%
- SFT + Process-level RL: 67.86%
- SFT + Outcome-level RL: 63.93%
2. **Error Recall**:
- SFT: 81.91%
- SFT + Process-level RL: 86.67%
- SFT + Outcome-level RL: 87.34%
3. **Correct Precision**:
- SFT: 65.58%
- SFT + Process-level RL: 73.59%
- SFT + Outcome-level RL: 69.80%
#### Right Chart (Self-correction Metrics)
1. **Incorrect to Correct**:
- SFT: 20.00%
- SFT + Process-level RL: 22.17%
- SFT + Outcome-level RL: 19.55%
2. **Correct to Incorrect**:
- SFT: 8.42%
- SFT + Process-level RL: 5.39%
- SFT + Outcome-level RL: 3.93%
---
### Key Observations
1. **Process-level RL Improves Verification**:
- Verification Accuracy increases by ~15% (58.31% → 67.86%) with Process-level RL.
- Error Recall and Correct Precision also show significant gains (81.91% → 86.67%, 65.58% → 73.59%).
2. **Outcome-level RL Has Mixed Effects**:
- Slightly lower Verification Accuracy (63.93%) compared to Process-level RL.
- Higher Error Recall (87.34%) but lower Correct Precision (69.80%) than Process-level RL.
3. **Self-correction Trade-offs**:
- Process-level RL achieves the highest **Incorrect to Correct** rate (22.17%).
- Outcome-level RL reduces **Correct to Incorrect** errors most effectively (3.93%).
---
### Interpretation
The data suggests that **Process-level RL** enhances the model's ability to verify and correct errors, particularly in recalling mistakes and improving precision. However, **Outcome-level RL** introduces trade-offs: while it slightly improves error recall, it underperforms in verification accuracy and precision. In self-correction, Process-level RL excels at fixing incorrect answers, but Outcome-level RL is more effective at avoiding overcorrection (reducing "Correct to Incorrect" errors). These results highlight the importance of balancing process and outcome-focused adjustments in reinforcement learning for language models.