\n
## Pie Chart: Relevance Assessment
### Overview
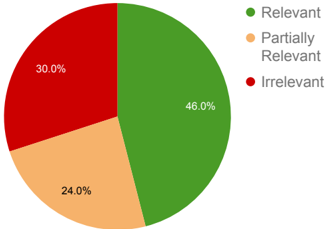
The image is a pie chart illustrating the distribution of relevance across three categories: Relevant, Partially Relevant, and Irrelevant. The chart visually represents the percentage breakdown of each category.
### Components/Axes
The chart consists of three slices, each representing a category. A legend is positioned to the right of the chart, associating colors with the categories.
* **Categories:** Relevant, Partially Relevant, Irrelevant
* **Colors:**
* Relevant: Green
* Partially Relevant: Orange/Yellow
* Irrelevant: Red
* **Percentages:** The chart displays percentages for each slice directly within the slices.
### Detailed Analysis
The pie chart shows the following distribution:
* **Relevant (Green):** The largest slice, occupying approximately 46.6% of the pie.
* **Partially Relevant (Orange/Yellow):** The second largest slice, occupying approximately 24.0% of the pie.
* **Irrelevant (Red):** The smallest slice, occupying approximately 30.0% of the pie.
The slices are arranged clockwise, starting with the largest (Relevant) at the top and proceeding to Partially Relevant and then Irrelevant.
### Key Observations
The "Relevant" category represents the largest proportion of the data, almost half of the total. The "Irrelevant" category is the second largest, representing nearly a third of the total. The "Partially Relevant" category is the smallest, representing just over a quarter of the total.
### Interpretation
The data suggests that a significant portion of the assessed items are considered "Relevant" (46.6%), indicating a substantial degree of usefulness or applicability. However, a considerable portion (30.0%) is deemed "Irrelevant," suggesting a need to filter or exclude these items. The "Partially Relevant" category (24.0%) indicates that a moderate amount of the assessed items have some value, but may require further refinement or consideration.
The chart likely represents an assessment of information, data, or items based on their relevance to a specific task, goal, or context. The distribution highlights the need for careful selection and prioritization of relevant information while discarding or re-evaluating irrelevant items. The presence of a "Partially Relevant" category suggests a nuanced evaluation process, acknowledging that some items may have limited or conditional value.