## Bar Chart: Distribution of Actions per Turn (Normalized)
### Overview
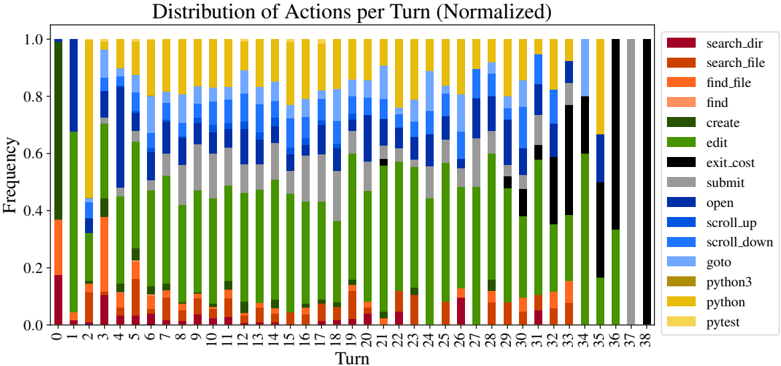
The image is a stacked bar chart showing the normalized frequency distribution of user actions across 38 turns. Each bar represents a turn, with segments colored according to specific actions. The y-axis ranges from 0.0 to 1.0 (frequency), and the x-axis spans turns 1–38. The legend on the right maps 14 distinct actions to colors.
### Components/Axes
- **X-axis (Turn)**: Labeled "Turn" with integer values 1–38.
- **Y-axis (Frequency)**: Labeled "Frequency" with values 0.0–1.0 in increments of 0.2.
- **Legend**: Located on the right, mapping colors to actions:
- Red: `search_dir`
- Orange: `search_file`
- Light orange: `find_file`
- Pink: `find`
- Green: `create`
- Dark green: `edit`
- Black: `exit_cost`
- Gray: `submit`
- Blue: `open`
- Light blue: `scroll_up`
- Dark blue: `scroll_down`
- Cyan: `goto`
- Yellow: `python3`
- Dark yellow: `pytest`
### Detailed Analysis
- **Turn 1**: Dominated by green (`create`, ~0.6) and orange (`search_file`, ~0.3). Total height ≈ 0.9.
- **Turn 2**: Green (`create`, ~0.5) and pink (`find`, ~0.2). Total ≈ 0.7.
- **Turn 3**: Green (`create`, ~0.4) and orange (`search_file`, ~0.2). Total ≈ 0.6.
- **Turn 4**: Green (`create`, ~0.3) and pink (`find`, ~0.1). Total ≈ 0.4.
- **Turn 5**: Green (`create`, ~0.5) and blue (`scroll_up`, ~0.3). Total ≈ 0.8.
- **Turn 6**: Green (`create`, ~0.4) and light blue (`scroll_down`, ~0.2). Total ≈ 0.6.
- **Turn 7**: Green (`create`, ~0.3) and dark blue (`scroll_down`, ~0.1). Total ≈ 0.4.
- **Turn 8**: Green (`create`, ~0.5) and gray (`submit`, ~0.2). Total ≈ 0.7.
- **Turn 9**: Green (`create`, ~0.4) and black (`exit_cost`, ~0.1). Total ≈ 0.5.
- **Turn 10**: Green (`create`, ~0.3) and yellow (`python3`, ~0.1). Total ≈ 0.4.
- **Turn 11–15**: Consistent green (`create`, ~0.3–0.4) with smaller segments of blue (`scroll_up`, ~0.1–0.2) and light blue (`scroll_down`, ~0.1–0.2).
- **Turn 16–20**: Green (`create`, ~0.3–0.4) with increasing dark blue (`scroll_down`, ~0.1–0.2) and occasional pink (`find`, ~0.1).
- **Turn 21–25**: Green (`create`, ~0.3–0.4) and dark blue (`scroll_down`, ~0.1–0.2). Yellow (`python`, ~0.1) appears in Turn 23.
- **Turn 26–30**: Green (`create`, ~0.3–0.4) and dark blue (`scroll_down`, ~0.1–0.2). Light blue (`scroll_up`, ~0.1) in Turn 28.
- **Turn 31–35**: Green (`create`, ~0.3–0.4) and dark blue (`scroll_down`, ~0.1–0.2). Black (`exit_cost`, ~0.1) in Turn 32.
- **Turn 36–38**: Green (`create`, ~0.3–0.4) and dark blue (`scroll_down`, ~0.1–0.2). Dark yellow (`pytest`, ~0.1) in Turn 37.
### Key Observations
1. **Dominant Actions**: `create` (green) is the most frequent action across all turns, with frequencies consistently above 0.3.
2. **Scrolling Behavior**: `scroll_down` (dark blue) and `scroll_up` (light blue) appear frequently but with lower frequencies (~0.1–0.2).
3. **Search Actions**: `search_file` (orange) and `find` (pink) are sporadic, peaking in Turns 1–4.
4. **Python-Related Actions**: `python3` (yellow) and `pytest` (dark yellow) appear only in later turns (10–38), suggesting a shift toward coding tasks.
5. **Normalization**: Each bar’s total height is ≤1.0, indicating normalized frequencies (e.g., Turn 1: 0.9 total actions).
### Interpretation
The chart reveals a pattern of prioritized actions: `create` dominates early turns, while `scroll_down` and `scroll_up` reflect navigation. The emergence of Python-related actions (`python3`, `pytest`) in later turns suggests a transition to coding or testing tasks. The normalization implies that users perform fewer actions per turn as the sequence progresses, possibly due to task complexity or fatigue. Outliers like `exit_cost` (black) and `submit` (gray) are rare but indicate critical steps in specific workflows. The absence of `goto` (cyan) and `open` (blue) in most turns highlights their niche usage.