## Diagram: Visual-Linguistic Reasoning Framework
### Overview
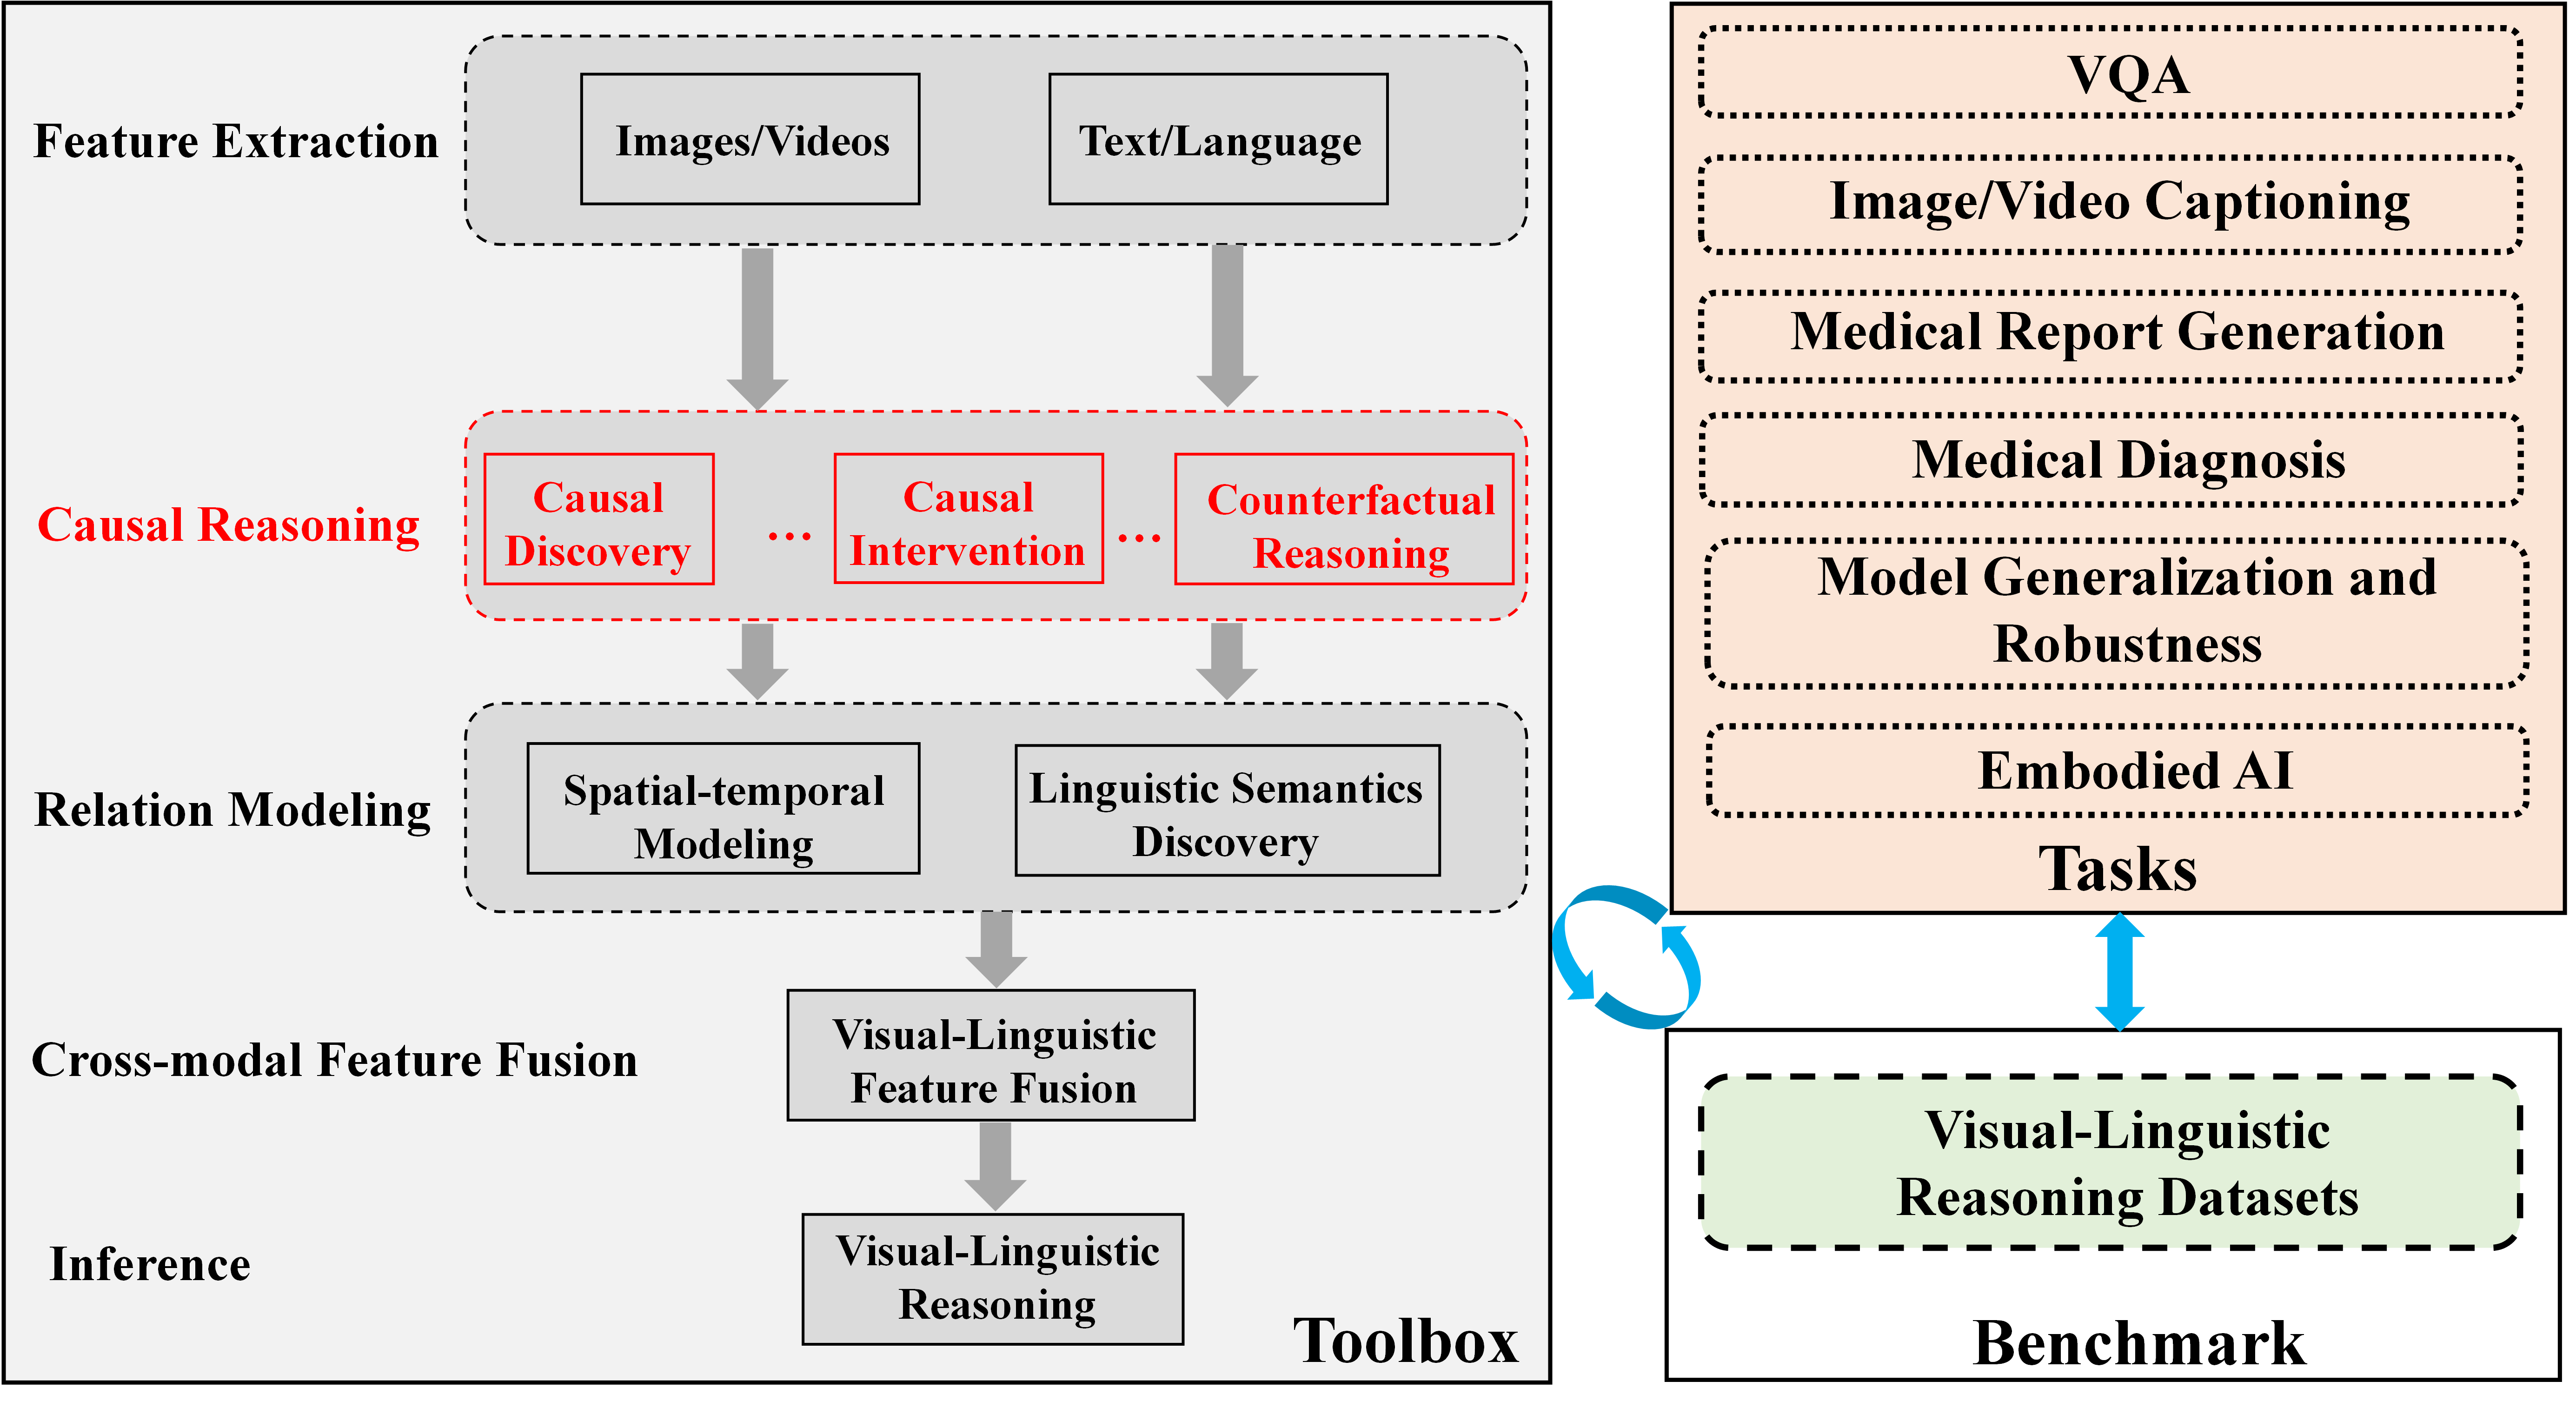
The image presents a diagram outlining a framework for visual-linguistic reasoning. It illustrates the flow of information and processes involved, starting from feature extraction and progressing through causal reasoning, relation modeling, cross-modal feature fusion, and inference. The diagram also highlights the connection between the "Toolbox" of reasoning processes and the "Benchmark" datasets used for evaluation, as well as the tasks that can be performed.
### Components/Axes
The diagram is structured into several key components:
* **Feature Extraction:** This is the initial stage, involving the extraction of features from "Images/Videos" and "Text/Language". The box is gray with a dashed border.
* **Causal Reasoning:** This stage focuses on causal inference, encompassing "Causal Discovery", "Causal Intervention", and "Counterfactual Reasoning". The box is red with a dashed border.
* **Relation Modeling:** This stage involves modeling relationships, including "Spatial-temporal Modeling" and "Linguistic Semantics Discovery". The box is gray with a dashed border.
* **Cross-modal Feature Fusion:** This stage combines visual and linguistic features through "Visual-Linguistic Feature Fusion".
* **Inference:** The final stage, where "Visual-Linguistic Reasoning" takes place.
* **Toolbox:** This encompasses the entire flow from Feature Extraction to Inference.
* **Tasks:** A set of tasks including "VQA", "Image/Video Captioning", "Medical Report Generation", "Medical Diagnosis", "Model Generalization and Robustness", and "Embodied AI". The box is light orange with a dashed border.
* **Benchmark:** This refers to "Visual-Linguistic Reasoning Datasets". The box is light green with a dashed border.
Arrows indicate the flow of information between these components. A blue curved arrow connects the "Benchmark" back to the "Tasks".
### Detailed Analysis or ### Content Details
* **Feature Extraction:**
* Input: Images/Videos, Text/Language
* Process: Extracting relevant features from the input data.
* **Causal Reasoning:**
* Sub-processes: Causal Discovery, Causal Intervention, Counterfactual Reasoning.
* Purpose: Inferring causal relationships between entities and events.
* **Relation Modeling:**
* Sub-processes: Spatial-temporal Modeling, Linguistic Semantics Discovery.
* Purpose: Understanding the spatial, temporal, and semantic relationships within the data.
* **Cross-modal Feature Fusion:**
* Process: Visual-Linguistic Feature Fusion.
* Purpose: Combining visual and linguistic features to create a unified representation.
* **Inference:**
* Process: Visual-Linguistic Reasoning.
* Purpose: Making inferences and predictions based on the fused features.
* **Tasks:**
* VQA (Visual Question Answering)
* Image/Video Captioning
* Medical Report Generation
* Medical Diagnosis
* Model Generalization and Robustness
* Embodied AI
* **Benchmark:**
* Visual-Linguistic Reasoning Datasets
### Key Observations
* The diagram illustrates a sequential flow of information, starting from feature extraction and culminating in inference.
* Causal reasoning and relation modeling are highlighted as important intermediate steps.
* The diagram emphasizes the integration of visual and linguistic information.
* The "Toolbox" provides the reasoning capabilities, while the "Benchmark" provides the data for evaluation.
* The "Tasks" represent the applications of the visual-linguistic reasoning framework.
### Interpretation
The diagram presents a comprehensive framework for visual-linguistic reasoning, highlighting the key stages and processes involved. It emphasizes the importance of causal reasoning, relation modeling, and cross-modal feature fusion in achieving effective reasoning capabilities. The connection between the "Toolbox" and the "Benchmark" underscores the importance of evaluating the framework's performance on relevant datasets. The "Tasks" demonstrate the potential applications of the framework in various domains, including VQA, image/video captioning, medical report generation, medical diagnosis, model generalization and robustness, and embodied AI. The blue arrow from the "Benchmark" to the "Tasks" suggests an iterative process of evaluation and refinement, where the performance on benchmark datasets informs the development and improvement of the reasoning framework.