\n
## Diagram: Visual-Linguistic Reasoning Pipeline
### Overview
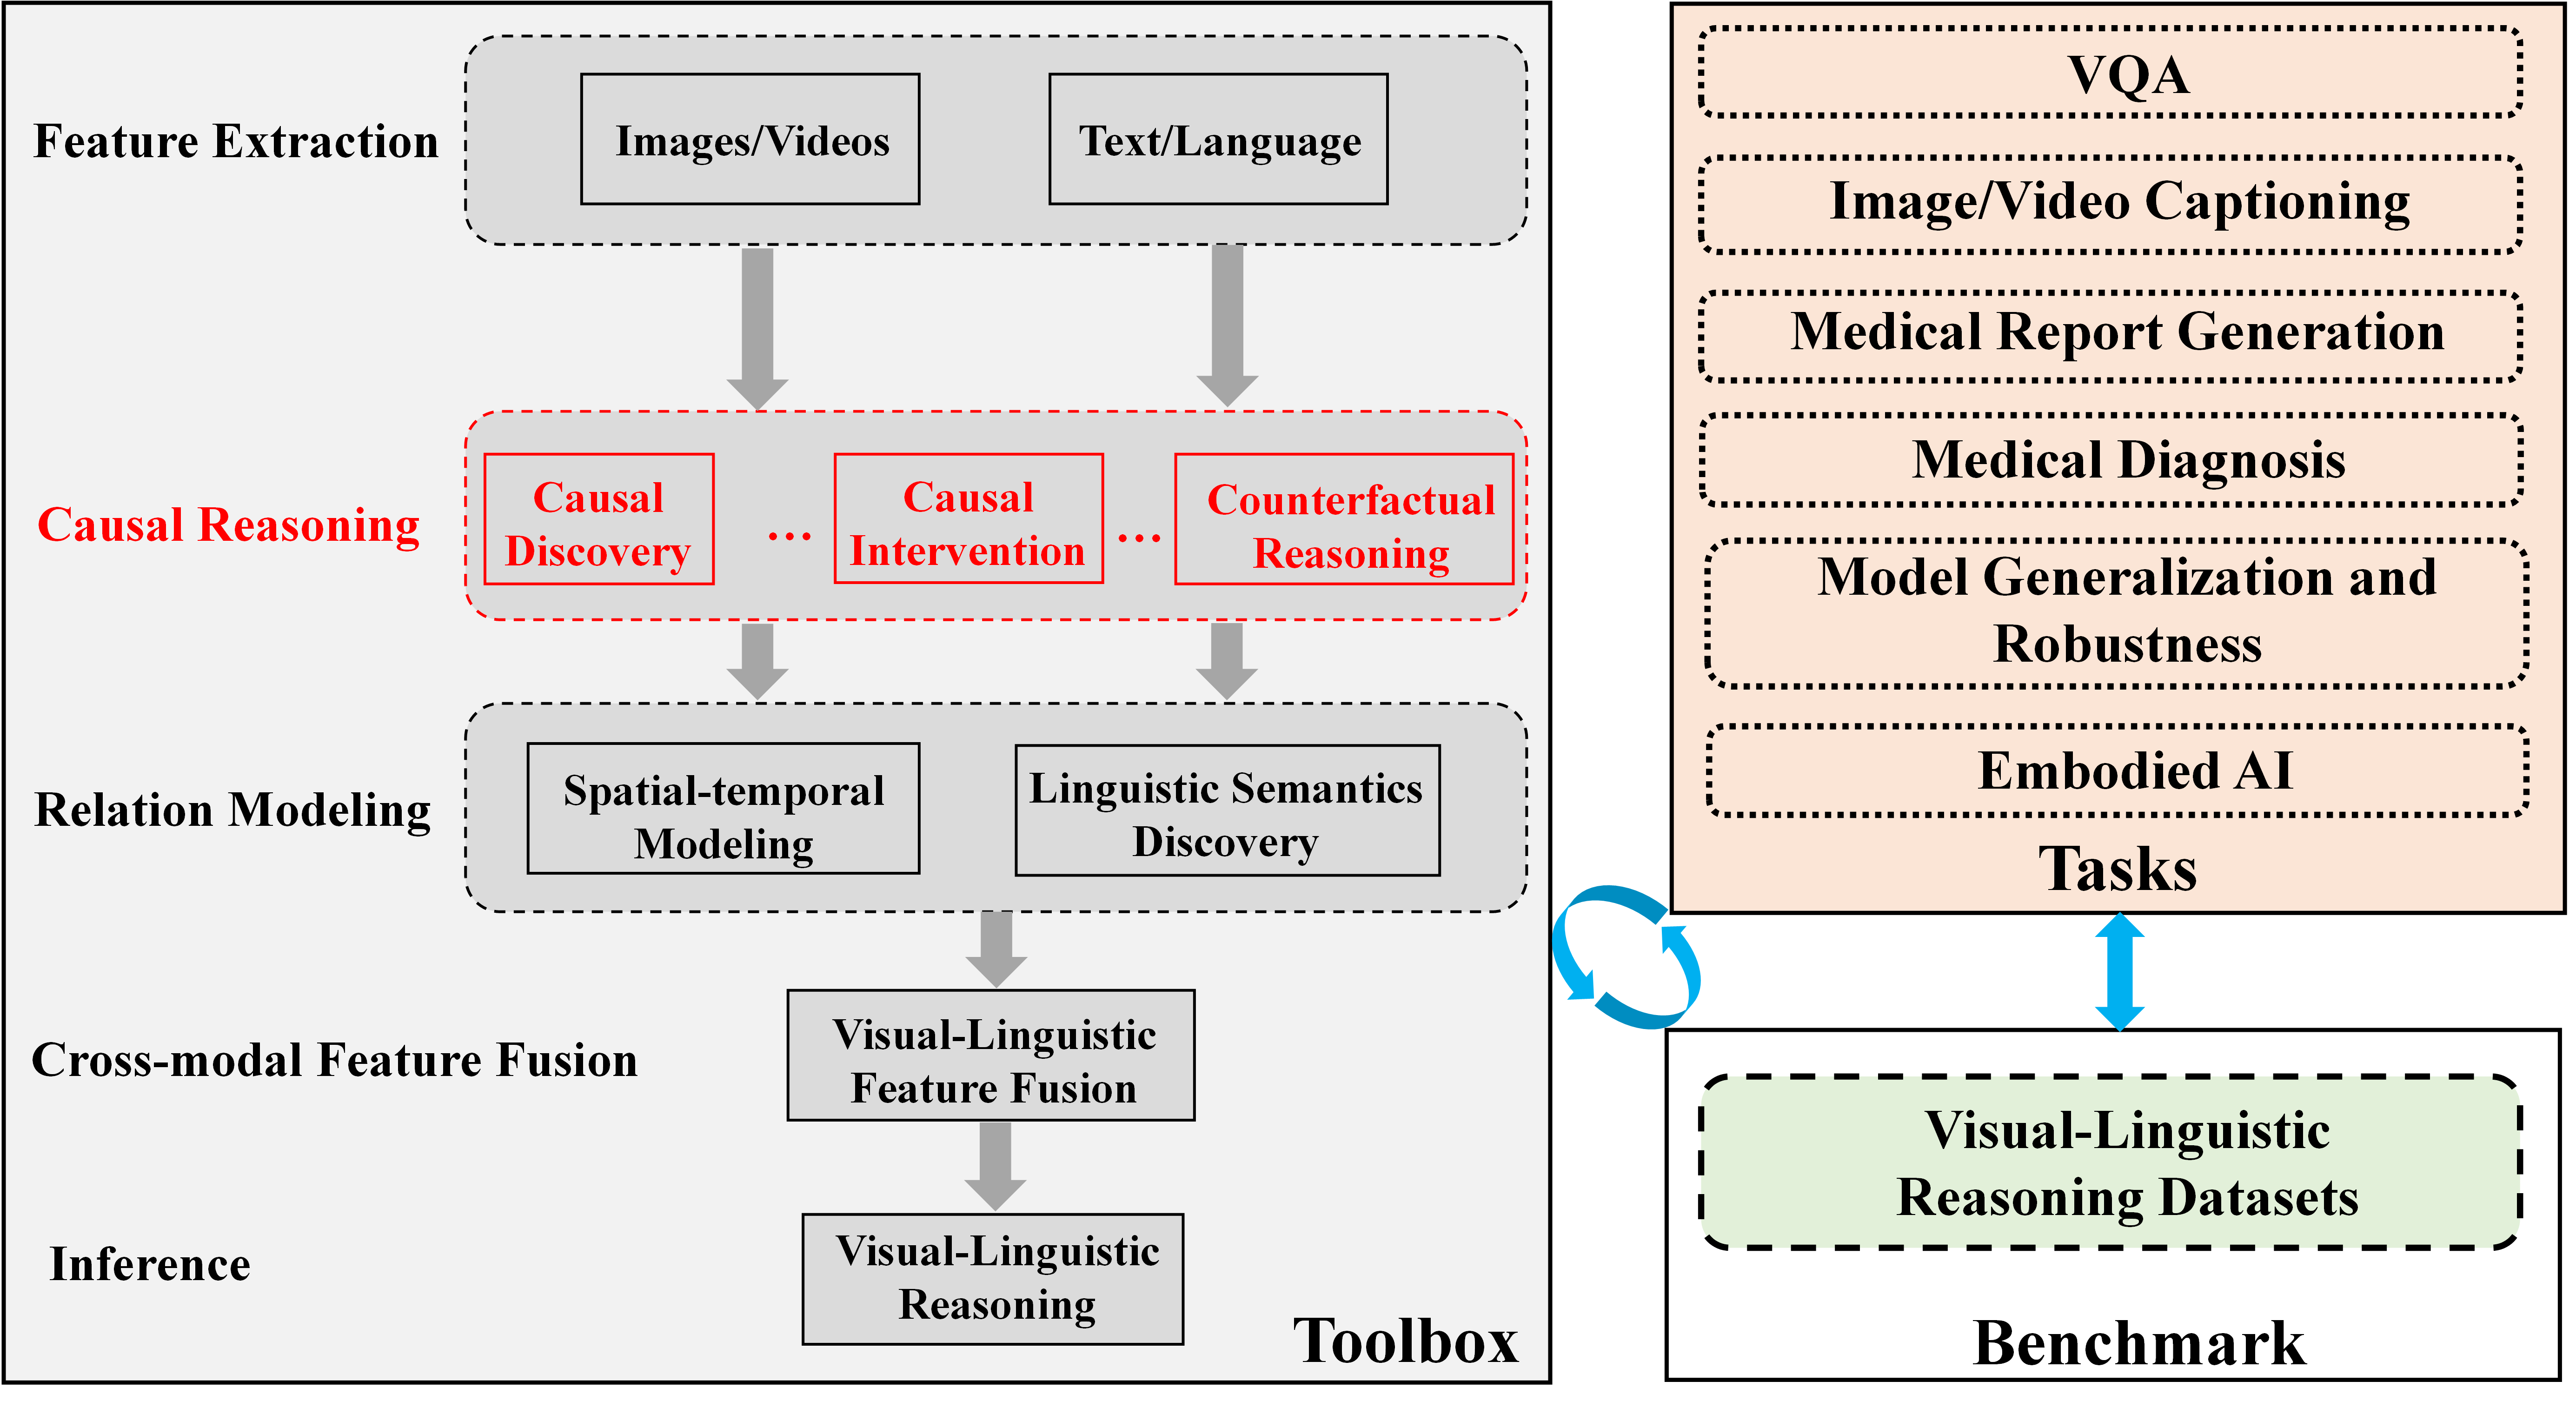
This diagram illustrates a pipeline for visual-linguistic reasoning, outlining the key stages from feature extraction to benchmark evaluation. The pipeline is structured around a toolbox that feeds into various downstream tasks. The diagram uses boxes and arrows to represent processes and data flow.
### Components/Axes
The diagram is divided into several main sections: Feature Extraction, Causal Reasoning, Relation Modeling, Cross-modal Feature Fusion, Inference, and a "VQA" (Visual Question Answering) section containing downstream tasks and a benchmark.
* **Feature Extraction:** Inputs are "Images/Videos" and "Text/Language".
* **Causal Reasoning:** Contains "Causal Discovery", "Causal Intervention", and "Counterfactual Reasoning".
* **Relation Modeling:** Contains "Spatial-temporal Modeling" and "Linguistic Semantics Discovery".
* **Cross-modal Feature Fusion:** Contains "Visual-Linguistic Feature Fusion".
* **Inference:** Contains "Visual-Linguistic Reasoning".
* **VQA Section:** Contains "Image/Video Captioning", "Medical Report Generation", "Medical Diagnosis", "Model Generalization and Robustness", and "Embodied AI Tasks".
* **Benchmark:** "Visual-Linguistic Reasoning Datasets".
* **Toolbox:** A large, central box labeled "Toolbox".
* Arrows indicate the flow of information between components.
### Detailed Analysis or Content Details
The diagram shows a hierarchical flow of information.
1. **Feature Extraction:** Images/Videos and Text/Language are inputs to the system.
2. **Causal Reasoning:** The outputs of Feature Extraction feed into Causal Reasoning, which branches into Causal Discovery, Causal Intervention, and Counterfactual Reasoning.
3. **Relation Modeling:** Feature Extraction also feeds into Relation Modeling, which branches into Spatial-temporal Modeling and Linguistic Semantics Discovery.
4. **Cross-modal Feature Fusion:** The outputs of Causal Reasoning and Relation Modeling converge into Cross-modal Feature Fusion, specifically "Visual-Linguistic Feature Fusion".
5. **Inference:** The output of Cross-modal Feature Fusion feeds into Inference, resulting in "Visual-Linguistic Reasoning".
6. **VQA Section:** The output of the Toolbox (which encompasses the previous stages) feeds into a variety of downstream tasks within the VQA section:
* Image/Video Captioning
* Medical Report Generation
* Medical Diagnosis
* Model Generalization and Robustness
* Embodied AI Tasks
7. **Benchmark:** The VQA section is evaluated using "Visual-Linguistic Reasoning Datasets" as a benchmark.
The diagram uses dashed arrows to indicate the flow from the Toolbox to the downstream tasks and from the downstream tasks to the Benchmark. There is a circular arrow between the VQA section and the Benchmark, suggesting an iterative process of evaluation and improvement.
### Key Observations
The diagram emphasizes the importance of integrating causal reasoning and relation modeling for effective visual-linguistic understanding. The Toolbox acts as a central hub for processing and integrating information from different modalities. The VQA section highlights the diverse applications of this technology, including medical diagnosis and embodied AI. The iterative loop between the VQA section and the benchmark suggests a continuous cycle of development and evaluation.
### Interpretation
This diagram represents a conceptual framework for building intelligent systems that can reason about visual and linguistic information. The pipeline structure suggests a modular approach, where each stage performs a specific function. The inclusion of causal reasoning and relation modeling indicates a focus on developing systems that can go beyond simple pattern recognition and understand the underlying relationships between objects and events. The diverse range of downstream tasks in the VQA section demonstrates the potential of this technology to address a wide range of real-world problems. The diagram suggests that the quality of the "Toolbox" is critical to the performance of the entire system. The benchmark serves as a crucial component for evaluating and improving the system's capabilities. The diagram does not provide specific data or numerical values, but rather a high-level overview of the system architecture and data flow. It is a conceptual illustration of a research direction rather than a report of specific results.