\n
## Diagram: Visual-Linguistic Reasoning Framework
### Overview
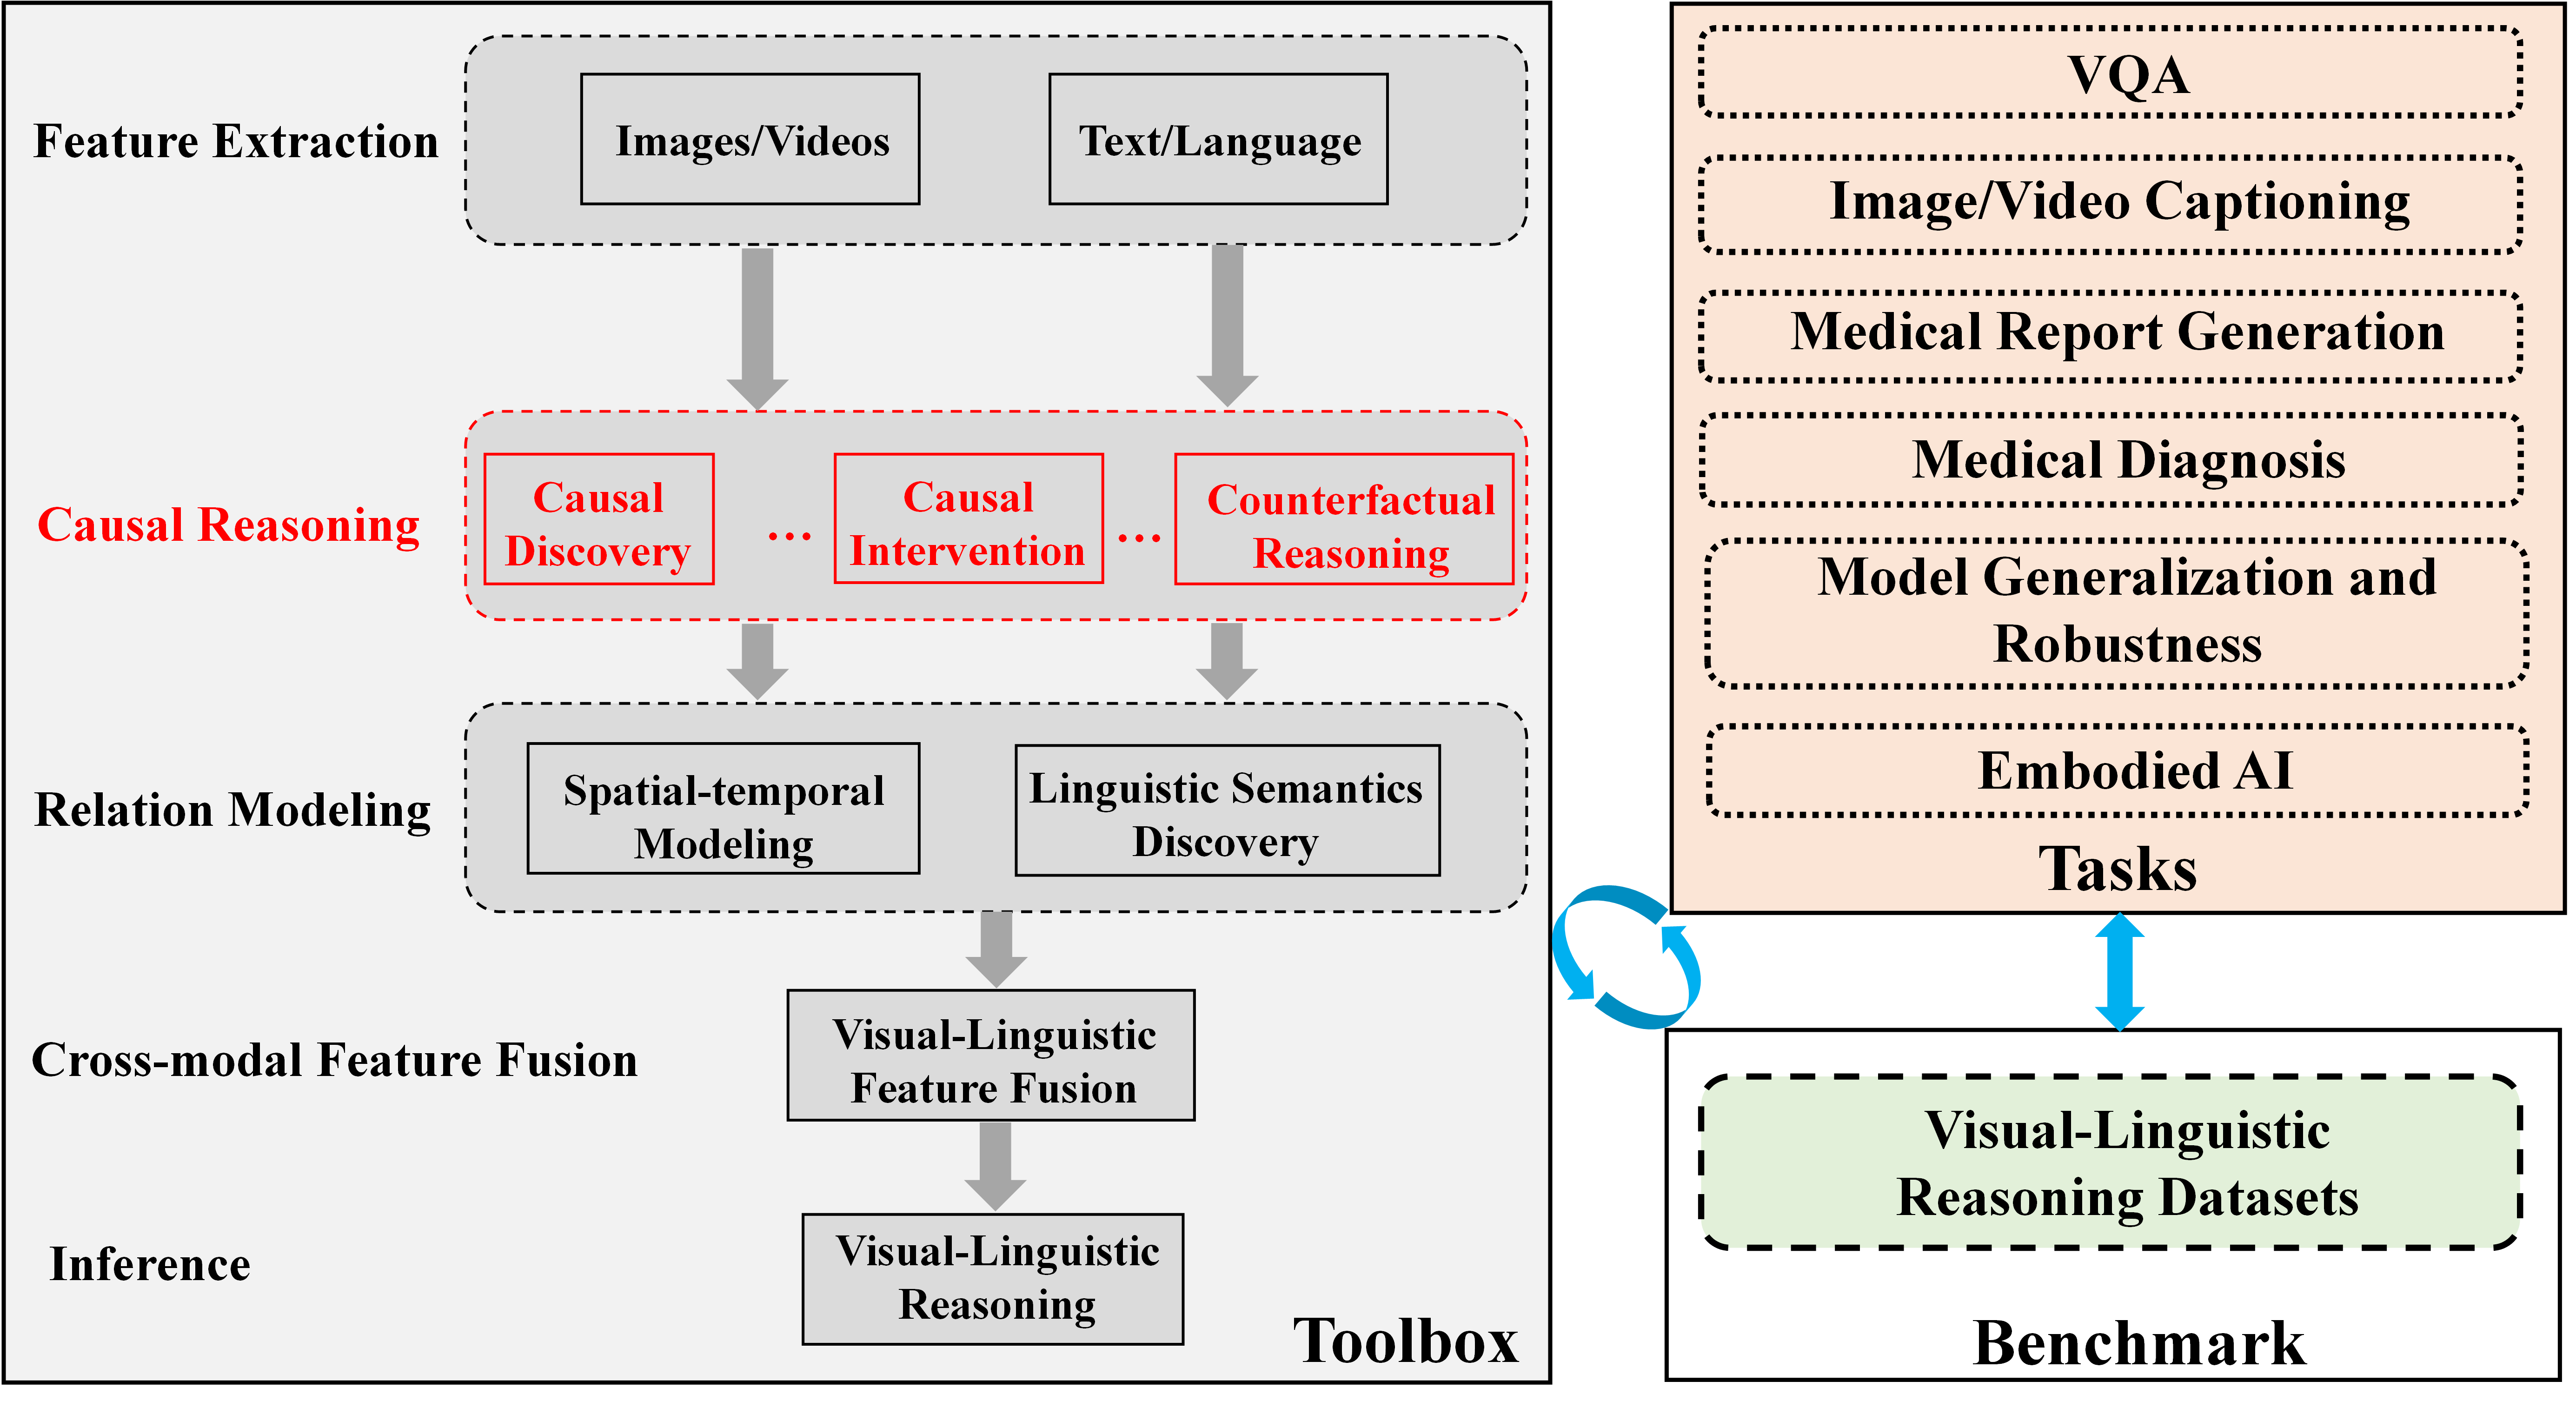
The image is a technical diagram illustrating a conceptual framework for a visual-linguistic reasoning system. It is divided into two primary sections: a **Toolbox** on the left, which outlines a sequential processing pipeline, and a **Benchmark** section on the right, which lists application tasks and datasets. The diagram uses boxes, arrows, and color-coding to denote components, data flow, and relationships.
### Components/Axes
The diagram is structured into two main vertical panels.
**Left Panel: Toolbox**
This panel is a vertical flowchart with labeled stages on the left and corresponding processing blocks on the right. The stages are:
1. **Feature Extraction** (top): Contains two input blocks: "Images/Videos" and "Text/Language".
2. **Causal Reasoning** (highlighted in red): Contains three sub-components in red-outlined boxes: "Causal Discovery", "Causal Intervention", and "Counterfactual Reasoning". Ellipses (`...`) are placed between these boxes.
3. **Relation Modeling**: Contains two blocks: "Spatial-temporal Modeling" and "Linguistic Semantics Discovery".
4. **Cross-modal Feature Fusion**: Contains a single block: "Visual-Linguistic Feature Fusion".
5. **Inference** (bottom): Contains a single block: "Visual-Linguistic Reasoning".
Thick grey arrows point downward from each stage to the next, indicating a sequential processing pipeline from feature extraction to final inference.
**Right Panel: Benchmark**
This panel is divided into two stacked boxes:
1. **Tasks** (top, peach-colored background): A list of six application domains in dashed-outline boxes:
* VQA
* Image/Video Captioning
* Medical Report Generation
* Medical Diagnosis
* Model Generalization and Robustness
* Embodied AI
2. **Visual-Linguistic Reasoning Datasets** (bottom, light green background): A single dashed-outline box containing the text "Visual-Linguistic Reasoning Datasets".
**Connections Between Panels:**
* A blue, double-headed vertical arrow connects the "Tasks" box and the "Visual-Linguistic Reasoning Datasets" box, indicating a bidirectional relationship (e.g., tasks define dataset needs, datasets enable task evaluation).
* A blue, circular arrow (↻) connects the right side of the "Toolbox" panel to the left side of the "Benchmark" panel, suggesting an iterative or feedback loop between the reasoning system and its evaluation.
### Detailed Analysis
The diagram explicitly details the following textual elements and their spatial relationships:
* **Toolbox Flow:** The pipeline is strictly linear from top to bottom: Feature Extraction → Causal Reasoning → Relation Modeling → Cross-modal Feature Fusion → Inference.
* **Causal Reasoning Emphasis:** The "Causal Reasoning" stage and its three sub-components are uniquely highlighted with red text and red box outlines, drawing specific attention to this part of the process.
* **Task List:** The six tasks under "Benchmark" are presented as a vertical list, suggesting they are key application areas for the visual-linguistic reasoning system.
* **Data Flow:** The primary data flow is downward through the Toolbox. The circular arrow introduces a secondary, cyclical flow between the entire Toolbox and the Benchmark suite.
### Key Observations
1. **Highlighted Causal Reasoning:** The use of red for the "Causal Reasoning" stage is the most prominent visual cue, indicating it is a core or novel component of this framework.
2. **Bidirectional Benchmark Link:** The double-headed arrow between Tasks and Datasets is significant, implying that benchmark development is not a one-way street; tasks inform dataset creation, and new datasets can enable or redefine tasks.
3. **Holistic Evaluation Loop:** The circular arrow connecting the Toolbox to the Benchmark suggests the system is designed for iterative improvement, where performance on benchmark tasks feeds back into refining the reasoning toolbox.
4. **Cross-Modal Focus:** The framework explicitly names "Visual-Linguistic" as the target modality for fusion and reasoning, and the tasks (VQA, Captioning) align with this focus.
### Interpretation
This diagram outlines a comprehensive research and development framework for advanced AI systems that integrate visual and linguistic understanding. It moves beyond simple pattern recognition by incorporating a dedicated **Causal Reasoning** module, which suggests an aim to build models that can understand "why" and "what if," not just "what."
The structure implies a hypothesis: robust visual-linguistic reasoning requires a pipeline that extracts features, applies causal logic, models relationships across space/time and language, fuses these modalities, and then performs high-level inference. The **Benchmark** section grounds this theoretical toolbox in practical applications, from medical diagnosis to embodied AI, showing the framework's intended scope.
The iterative loop between the Toolbox and Benchmark is critical. It represents the scientific cycle of building systems, testing them against standardized challenges (datasets), and using the results to improve the systems. This framework is likely intended to guide the creation of more generalizable, robust, and causally-aware multimodal AI models.