## Diagram: Visual-Linguistic Reasoning System Architecture
### Overview
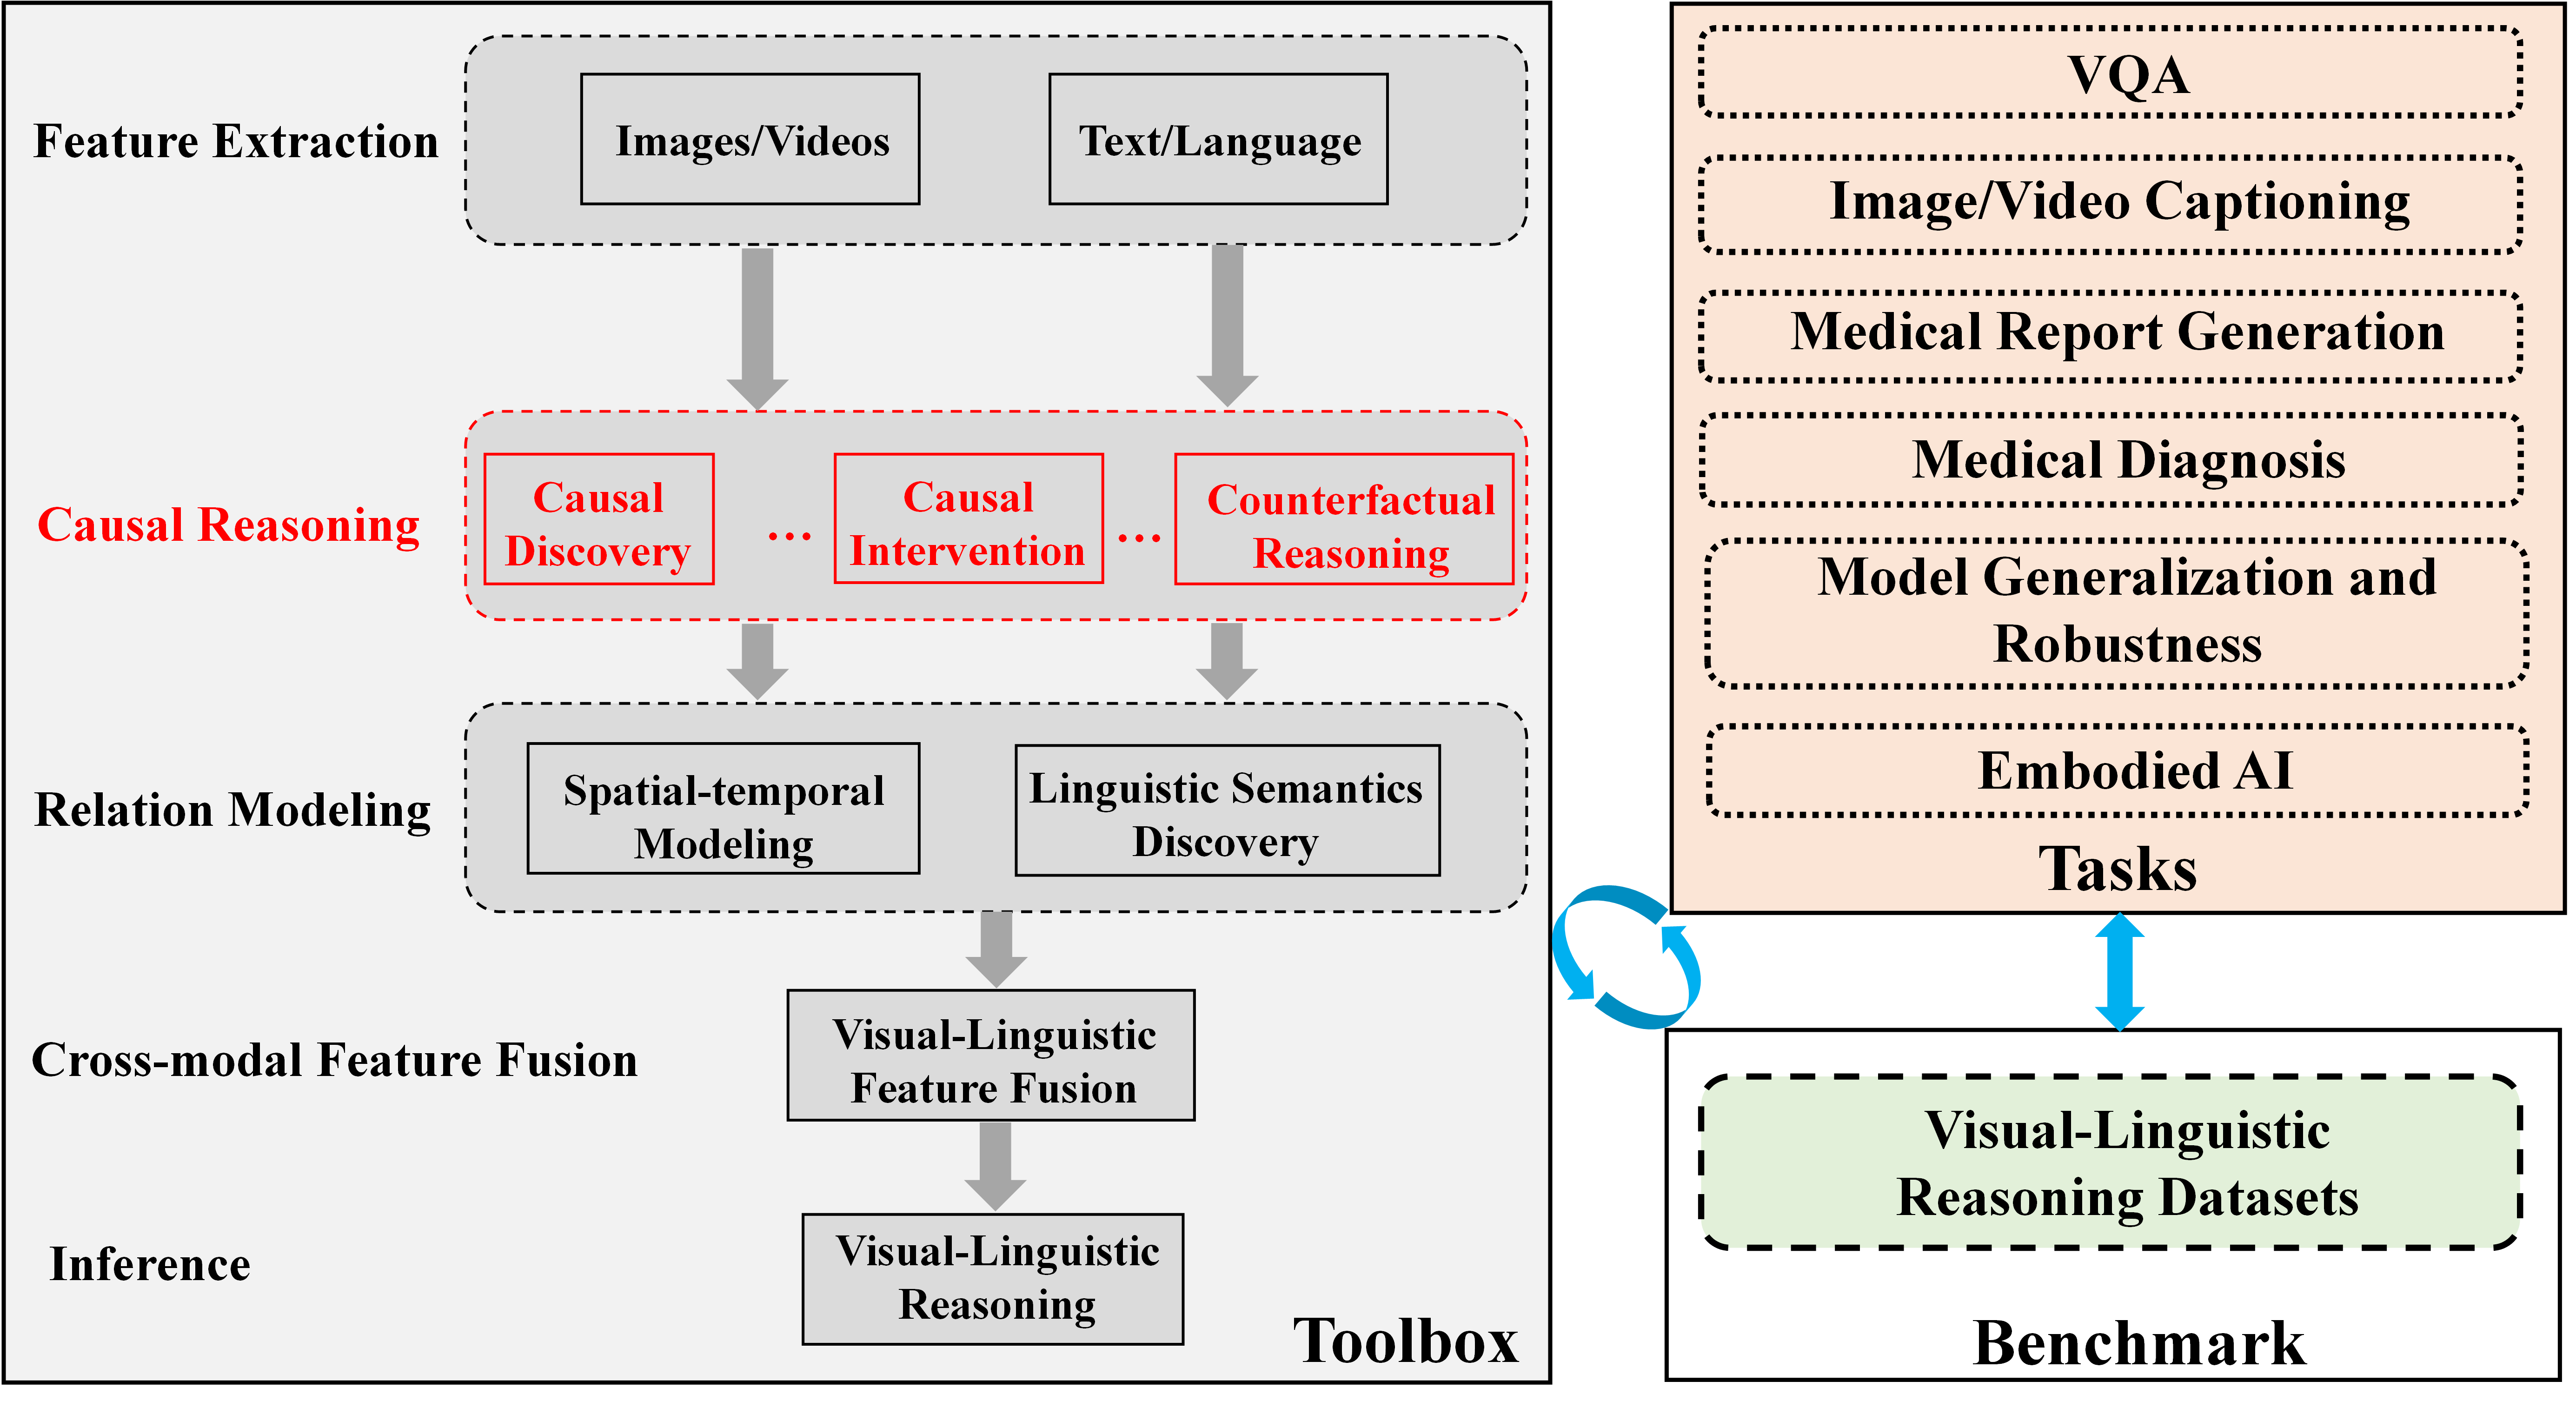
The diagram illustrates a two-part system architecture for visual-linguistic reasoning. The left side depicts a sequential processing pipeline with hierarchical stages, while the right side shows application tasks and benchmark datasets. A circular arrow connects the tasks to the benchmark, indicating iterative evaluation.
### Components/Axes
**Left Diagram (Processing Pipeline):**
- **Stages (Top to Bottom):**
1. **Feature Extraction**
- Sub-components: Images/Videos, Text/Language
2. **Causal Reasoning**
- Sub-components: Causal Discovery, Causal Intervention, Counterfactual Reasoning
3. **Relation Modeling**
- Sub-components: Spatial-temporal Modeling, Linguistic Semantics Discovery
4. **Cross-modal Feature Fusion**
- Sub-component: Visual-Linguistic Feature Fusion
5. **Inference**
- Sub-component: Visual-Linguistic Reasoning
- **Footer Label:** Toolbox
**Right Diagram (Tasks & Benchmark):**
- **Embedded AI Tasks (Top to Bottom):**
1. VQA
2. Image/Video Captioning
3. Medical Report Generation
4. Medical Diagnosis
5. Model Generalization and Robustness
- **Benchmark (Bottom):**
- Visual-Linguistic Reasoning Datasets
- **Connecting Element:**
- Blue circular arrow linking tasks to benchmark
### Detailed Analysis
**Left Diagram Flow:**
1. **Feature Extraction** processes raw inputs (images/videos and text/language).
2. **Causal Reasoning** introduces three parallel sub-processes (discovery, intervention, counterfactual reasoning), suggesting multi-path analysis.
3. **Relation Modeling** combines spatial-temporal and linguistic semantics analysis.
4. **Cross-modal Fusion** integrates visual and linguistic features.
5. **Inference** produces final reasoning outputs.
**Right Diagram Structure:**
- **Tasks** are vertically stacked, with "Medical Diagnosis" and "Model Generalization" positioned centrally, implying higher priority or complexity.
- **Benchmark** is isolated at the bottom, connected via a circular arrow to all tasks, indicating cyclical evaluation.
### Key Observations
1. **Hierarchical Complexity:** The left diagram shows increasing abstraction from raw data (Feature Extraction) to final reasoning (Inference).
2. **Causal Emphasis:** The red-highlighted "Causal Reasoning" stage suggests this is a core differentiator of the system.
3. **Task-Benchmark Relationship:** The circular arrow implies continuous benchmarking of all tasks, not just isolated evaluation.
4. **Medical Focus:** Medical-related tasks (Report Generation, Diagnosis) occupy 40% of the right diagram, indicating domain specialization.
### Interpretation
This architecture represents a comprehensive system for visual-linguistic reasoning with three key insights:
1. **Causal-Centric Design:** The explicit inclusion of causal reasoning stages (discovery, intervention, counterfactual) suggests the system prioritizes understanding cause-effect relationships over pattern recognition alone.
2. **Iterative Evaluation:** The circular connection between tasks and benchmark implies a feedback loop where task performance directly informs dataset development or model refinement.
3. **Medical Specialization:** The prominence of medical tasks indicates this system is optimized for healthcare applications, particularly in interpreting multimodal medical data (images + reports).
The "Toolbox" label at the bottom left suggests this is a modular framework where components can be customized or extended. The absence of quantitative metrics in the diagram implies this is a conceptual architecture rather than a performance benchmark visualization.