## Combined Diagram and Bar Chart: Verification Paradigms and Performance Gains
### Overview
The image contains two primary components:
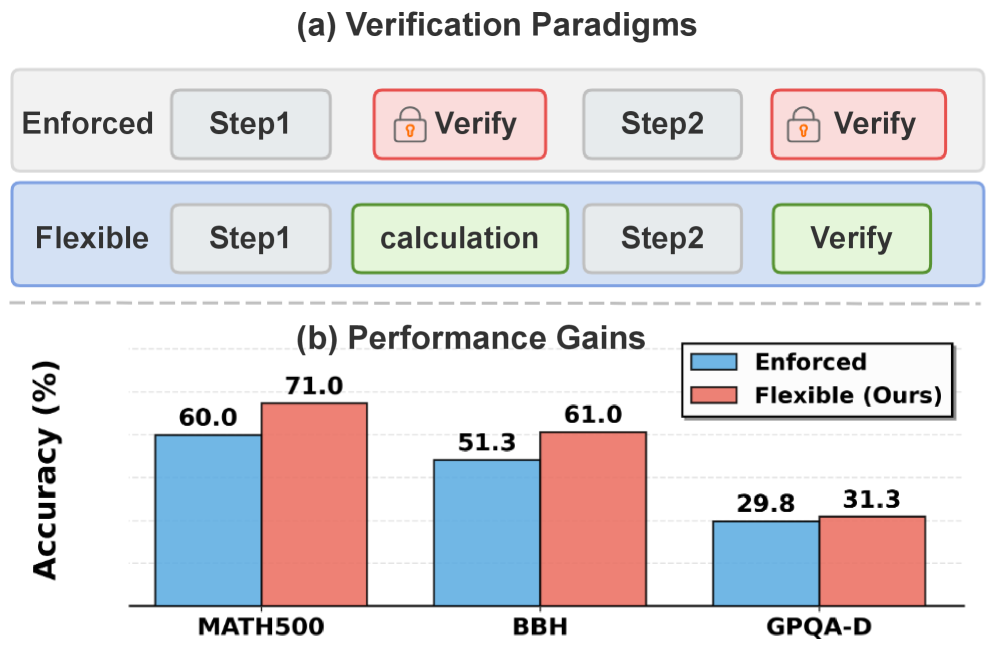
1. **(a) Verification Paradigms**: A comparative diagram illustrating two verification workflows ("Enforced" and "Flexible") with labeled steps and verification points.
2. **(b) Performance Gains**: A grouped bar chart comparing accuracy (%) between "Enforced" and "Flexible" paradigms across three tasks: MATH500, BBH, and GPQA-D.
---
### Components/Axes
#### (a) Verification Paradigms
- **Structure**:
- **Enforced**:
- Step1 (gray box) → Verify (red box with lock icon) → Step2 (gray box) → Verify (red box with lock icon).
- **Flexible**:
- Step1 (gray box) → calculation (green box) → Step2 (gray box) → Verify (green box).
- **Colors**:
- Enforced: Blue background with red-highlighted "Verify" steps.
- Flexible: Light blue background with green-highlighted "Verify" step.
- **Text**:
- Labels: "Enforced", "Flexible", "Step1", "Step2", "Verify", "calculation".
- Icons: Lock symbols in red "Verify" steps (Enforced) and green "Verify" step (Flexible).
#### (b) Performance Gains
- **Axes**:
- **Y-axis**: Accuracy (%) from 0 to 80 (linear scale).
- **X-axis**: Tasks labeled "MATH500", "BBH", "GPQA-D".
- **Bars**:
- **Enforced**: Blue bars (left in each group).
- **Flexible (Ours)**: Red bars (right in each group).
- **Legend**:
- Located in the top-right corner of the chart.
- Blue = Enforced, Red = Flexible (Ours).
---
### Detailed Analysis
#### (a) Verification Paradigms
- **Enforced Workflow**:
- Two rigid verification steps (Step1 and Step2) separated by mandatory "Verify" checks (red boxes with locks).
- **Flexible Workflow**:
- Replaces Step2 with a "calculation" phase (green box), followed by a single "Verify" step (green box).
- **Spatial Notes**:
- Enforced is positioned above Flexible, separated by a dashed line.
- "Verify" steps are visually emphasized via color (red/green) and lock icons.
#### (b) Performance Gains
- **Data Points**:
- **MATH500**:
- Enforced: 60.0%
- Flexible: 71.0%
- **BBH**:
- Enforced: 51.3%
- Flexible: 61.0%
- **GPQA-D**:
- Enforced: 29.8%
- Flexible: 31.3%
- **Trends**:
- Flexible paradigm consistently outperforms Enforced across all tasks.
- Largest gain in MATH500 (+11.0%), followed by BBH (+9.7%), and minimal gain in GPQA-D (+1.5%).
---
### Key Observations
1. **Performance Gains**:
- Flexible paradigm improves accuracy by **11.0% (MATH500)**, **9.7% (BBH)**, and **1.5% (GPQA-D)** compared to Enforced.
2. **Verification Step Impact**:
- Enforced requires two verification steps, while Flexible replaces Step2 with a calculation phase and a single verification.
3. **Task-Specific Variability**:
- GPQA-D shows the smallest gain, suggesting task-dependent effectiveness of the Flexible approach.
---
### Interpretation
- **Paradigm Effectiveness**:
The Flexible paradigm’s higher accuracy suggests that reducing rigid verification steps (e.g., replacing Step2 with a calculation phase) improves performance. This may indicate that overly strict verification introduces unnecessary constraints.
- **Task Dependency**:
The minimal gain in GPQA-D implies that the benefits of flexibility are more pronounced in tasks like MATH500 and BBH, which may involve more structured or calculative reasoning.
- **Design Implications**:
The diagram highlights a trade-off between verification rigor and efficiency. The Flexible approach’s success suggests that adaptive verification (e.g., calculation-phase validation) could be prioritized in workflows without compromising accuracy.
---
**Note**: All values and trends are extracted directly from the chart and diagram labels. Colors and spatial relationships were cross-verified with the legend and positional cues.