\n
## SHAP Value Visualization: Feature Importance
### Overview
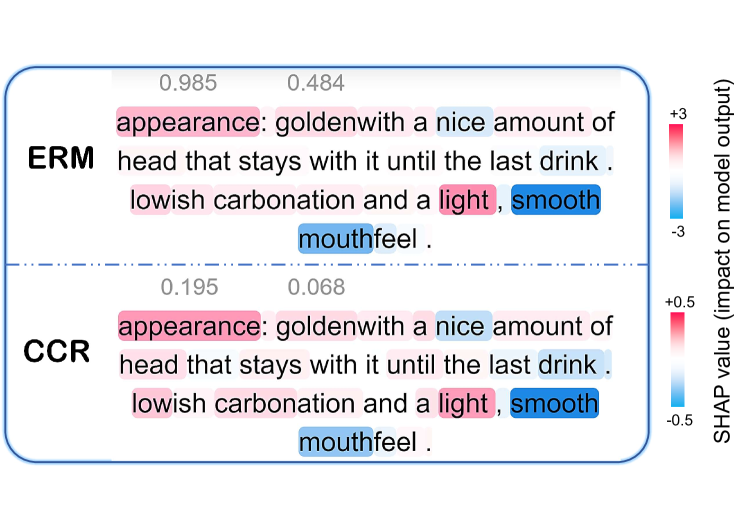
The image presents a visualization of SHAP (SHapley Additive exPlanations) values for two features, "ERM" and "CCR", related to a model output. The visualization displays the impact of each feature on the model's prediction, along with the feature's descriptive text. The SHAP values are color-coded to indicate positive or negative impacts.
### Components/Axes
* **Features:** ERM (top), CCR (bottom)
* **SHAP Value Scale:** Ranges from approximately -3 to +3 for ERM, and -0.5 to +0.5 for CCR. The scale is represented by a color gradient on the right side of the image.
* **Color Legend:**
* Red: Positive SHAP value (increases model output)
* Blue: Negative SHAP value (decreases model output)
* White: SHAP value close to zero (little impact)
* **Feature Descriptions:** Textual descriptions associated with each feature.
* **Numerical Values:** Two numerical values are displayed above each feature description.
### Detailed Analysis or Content Details
**ERM:**
* Numerical Values: 0.985 and 0.484
* Description: "appearance: goldenwith a nice amount of head that stays with it until the last drink . lowish carbonation and a light , smooth mouthfeel ."
* SHAP Value Indication: The text "smooth" is highlighted in blue, suggesting a negative impact on the model output. The overall SHAP value for ERM appears to be positive, indicated by the predominantly red color in the surrounding area (though not explicitly shown).
**CCR:**
* Numerical Values: 0.195 and 0.068
* Description: "appearance: goldenwith a nice amount of head that stays with it until the last drink . lowish carbonation and a light , smooth mouthfeel ."
* SHAP Value Indication: The text "smooth" is highlighted in blue, suggesting a negative impact on the model output. The overall SHAP value for CCR appears to be slightly positive, indicated by the light red color in the surrounding area (though not explicitly shown).
### Key Observations
* Both features share the same descriptive text.
* The term "smooth" consistently appears to have a negative impact on the model output, as indicated by the blue highlighting.
* ERM has a significantly larger range of SHAP values compared to CCR, suggesting it has a more substantial impact on the model's predictions.
* The numerical values (0.985, 0.484 for ERM and 0.195, 0.068 for CCR) are not directly explained in the context of SHAP values, but may represent some form of feature importance or contribution.
### Interpretation
This visualization aims to explain how the features "ERM" and "CCR" contribute to the model's predictions. The SHAP values quantify the impact of each feature, indicating whether it increases or decreases the model's output. The consistent negative impact of "smooth" suggests that the model associates this characteristic with a lower prediction value. The larger SHAP value range for ERM implies that this feature is more influential in determining the model's output than CCR. The numerical values provided alongside each feature may represent the magnitude of the feature's contribution or its overall importance within the dataset. The identical descriptions for both features suggest they are closely related or potentially redundant, and the model may be treating them similarly.