## [Textual Analysis with SHAP Value Visualization]: Model Interpretability for Beverage Description
### Overview
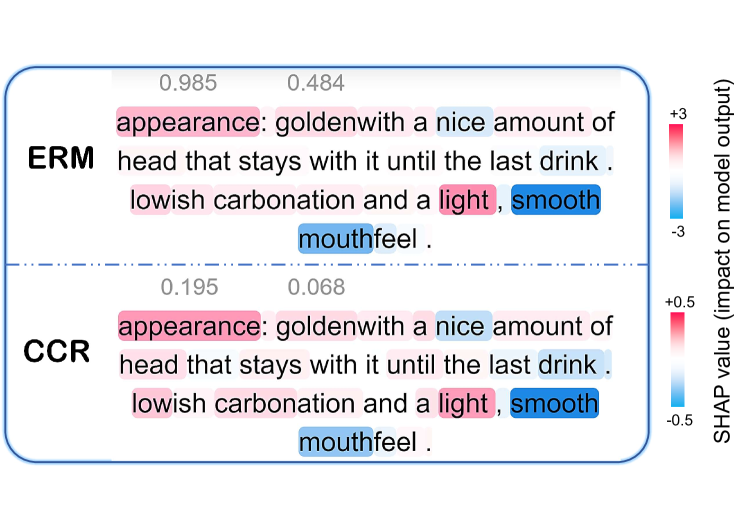
The image is a technical visualization comparing the interpretability of two machine learning models, labeled **ERM** and **CCR**, applied to the same descriptive text about a beverage (likely beer). It uses SHAP (SHapley Additive exPlanations) values to highlight which words in the text most influence each model's output. The visualization is split into two horizontal panels, one for each model, with a shared color-coded legend on the right.
### Components/Axes
1. **Main Panels**: Two rectangular panels with rounded corners, separated by a horizontal dashed line.
* **Top Panel**: Labeled **ERM** in bold, black text on the left.
* **Bottom Panel**: Labeled **CCR** in bold, black text on the left.
2. **Text Content**: Both panels contain identical English text:
> `appearance: golden with a nice amount of head that stays with it until the last drink. lowish carbonation and a light, smooth mouthfeel.`
3. **Highlighted Words & Numerical Values**: Specific words within the text are highlighted with a background color (pink or blue). A numerical value is placed directly above each highlighted word.
4. **Legend/Color Scale**: Located on the far right of the image, oriented vertically.
* **Title**: `SHAP value (impact on model output)`
* **ERM Scale (Top)**: A gradient bar from blue (labeled `-3`) to pink (labeled `+3`).
* **CCR Scale (Bottom)**: A gradient bar from blue (labeled `-0.5`) to pink (labeled `+0.5`).
* **Interpretation**: Pink indicates a **positive** SHAP value (increases the model's output). Blue indicates a **negative** SHAP value (decreases the model's output). The intensity of the color corresponds to the magnitude of the value.
### Detailed Analysis
**ERM Model (Top Panel):**
* **Word: "appearance"** - Highlighted **pink**. Value: **0.985**. This is the highest positive impact in the entire visualization.
* **Word: "nice"** - Highlighted **pink**. Value: **0.484**.
* **Word: "light"** - Highlighted **pink**. No explicit numerical value is shown above it, but its pink color indicates a positive SHAP value.
* **Word: "smooth"** - Highlighted **blue**. No explicit numerical value is shown above it, but its blue color indicates a negative SHAP value.
* **Word: "mouthfeel"** - Highlighted **blue**. No explicit numerical value is shown above it, but its blue color indicates a negative SHAP value.
**CCR Model (Bottom Panel):**
* **Word: "appearance"** - Highlighted **pink**. Value: **0.195**.
* **Word: "nice"** - Highlighted **pink**. Value: **0.068**.
* **Word: "light"** - Highlighted **pink**. No explicit numerical value is shown above it.
* **Word: "smooth"** - Highlighted **blue**. No explicit numerical value is shown above it.
* **Word: "mouthfeel"** - Highlighted **blue**. No explicit numerical value is shown above it.
**Trend Verification & Cross-Reference:**
* Both models assign **positive impact (pink)** to the words "appearance," "nice," and "light."
* Both models assign **negative impact (blue)** to the words "smooth" and "mouthfeel."
* The **ERM model shows significantly higher magnitude SHAP values** (scale: -3 to +3) compared to the **CCR model** (scale: -0.5 to +0.5). For example, "appearance" has an impact of 0.985 in ERM vs. 0.195 in CCR.
* The color of each highlighted word consistently matches the sign (positive/negative) indicated by the corresponding model's color scale on the right.
### Key Observations
1. **Consistent Word Importance Ranking**: Both models agree on the *direction* of influence for the highlighted words. "Appearance" and "nice" are the most positively influential terms, while "smooth" and "mouthfeel" are negatively influential.
2. **Divergence in Impact Magnitude**: The primary difference between the models is the **scale of influence**. ERM's decisions are much more strongly swayed by these specific words than CCR's decisions are.
3. **Selective Highlighting**: Only five words out of the entire description are highlighted. Words like "golden," "head," "carbonation," and "lowish" are not highlighted, suggesting they have a near-zero SHAP value (minimal impact) for both models on this specific output.
4. **Spatial Layout**: The legend is positioned to the right of both panels, allowing for direct visual comparison of the color intensities between the two models. The numerical values are placed directly above their corresponding words for precise reading.
### Interpretation
This visualization is a tool for **model explainability**. It answers the question: "Which parts of this product description did the model find most important when making its prediction?"
* **What the data suggests**: For the task these models are performing (e.g., sentiment analysis, quality scoring, category classification), the **"appearance"** of the beverage is the single most critical feature, strongly pushing the model's output in a positive direction. The word **"nice"** also contributes positively. Conversely, the descriptors **"smooth"** and **"mouthfeel"** are associated with a decrease in the model's output score.
* **How elements relate**: The identical text is the constant input. The two models (ERM and CCR) are the variables. The SHAP values are the measured output, revealing the internal "reasoning" of each model. The stark difference in scale suggests ERM may be a more complex or less regularized model that places extreme weight on certain features, while CCR appears more conservative or balanced in its feature attribution.
* **Notable Anomaly/Insight**: The negative impact of "smooth" and "mouthfeel" is counter-intuitive, as these are typically positive attributes for a beverage. This could indicate:
1. The model's target variable is something other than general quality (e.g., it might be predicting "bitterness" or "style," where "smooth" is a negative indicator).
2. A potential bias or artifact in the training data.
3. That these words, in this specific combination and context, are statistically associated with a lower model score.
This discrepancy between common sense and model behavior is precisely the kind of insight such interpretability visualizations are designed to uncover, prompting further investigation into the model's training and objectives.