## Integrated Information Theory (IIT) Diagrams
### Overview
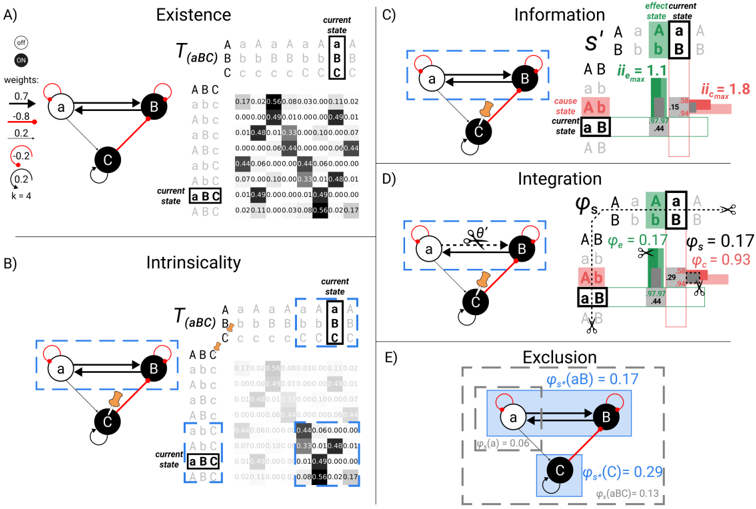
The image presents a series of diagrams illustrating concepts from Integrated Information Theory (IIT). It covers Existence, Intrinsicality, Information, Integration, and Exclusion, using network diagrams and probability matrices to represent the relationships between elements in a system.
### Components/Axes
**A) Existence**
* **Title:** Existence
* **Diagram:** A network diagram with three nodes labeled 'a', 'B', and 'C'. Node 'a' has a self-loop (red), and connections to 'B' (black) and 'C' (red). Node 'B' has a self-loop (black), and a connection to 'a' (black). Node 'C' has a self-loop (black), and a connection to 'B' (red).
* **Weights:** Listed on the left side of the diagram:
* 'a' self-loop: 0.7
* 'a' to 'B': -0.8
* 'a' to 'C': 0.2
* 'C' to 'B': -0.2
* 'C' self-loop: 0.2
* k = 4
* **Transition Probability Matrix:** A 3x3 matrix labeled T(aBC) showing the transition probabilities between states A, B, and C. The columns represent the current state (A, B, C), and the rows represent the next state (a, b, c).
| | A | B | C |
| :---- | :---- | :---- | :---- |
| a | 0.17 | 0.02 | 0.56 |
| b | 0.00 | 0.49 | 0.01 |
| c | 0.01 | 0.48 | 0.01 |
| A | 0.00 | 0.00 | 0.06 |
| B | 0.44 | 0.06 | 0.00 |
| C | 0.07 | 0.00 | 0.10 |
| a | 0.01 | 0.49 | 0.00 |
| b | 0.02 | 0.11 | 0.00 |
| c | 0.00 | 0.03 | 0.00 |
**B) Intrinsicality**
* **Title:** Intrinsicality
* **Diagram:** Similar to the Existence diagram, but enclosed in a dashed blue box.
* **Transition Probability Matrix:** A 3x3 matrix labeled T(aBC) showing the transition probabilities between states A, B, and C. The columns represent the current state (A, B, C), and the rows represent the next state (a, b, c). The matrix is enclosed in a dashed blue box.
| | A | B | C |
| :---- | :---- | :---- | :---- |
| a | 0.17 | 0.02 | 0.56 |
| b | 0.00 | 0.00 | 0.49 |
| c | 0.01 | 0.48 | 0.01 |
| A | 0.00 | 0.00 | 0.06 |
| B | 0.44 | 0.06 | 0.00 |
| C | 0.07 | 0.00 | 0.10 |
| a | 0.01 | 0.49 | 0.00 |
| b | 0.02 | 0.11 | 0.00 |
| c | 0.00 | 0.03 | 0.00 |
**C) Information**
* **Title:** Information
* **Diagram:** Similar network diagram to A and B, enclosed in a dashed blue box.
* **Information Structure S':** A matrix showing the cause-effect structure.
* Columns: effect current state (A, B)
* Rows: cause current state (a, b)
* ii_emax = 1.1
* ii_cmax = 1.8
* Probabilities are represented by green (cause) and red (effect) bars.
* The values are:
* A -> a: 97.97
* A -> b: 0.44
* B -> a: 0.15
* B -> b: 58.29
**D) Integration**
* **Title:** Integration
* **Diagram:** Similar network diagram to A, B, and C, enclosed in a dashed blue box. A dashed line with scissors indicates a cut between nodes 'a' and 'B'.
* **Partitioned Information Structure φs:** A matrix showing the partitioned cause-effect structure.
* Columns: effect current state (A, B)
* Rows: cause current state (a:B, a:b)
* φe = 0.17
* φs = 0.17
* φc = 0.93
* Probabilities are represented by green (cause) and red (effect) bars.
* The values are:
* A -> a: 97.97
* A -> b: 0.44
* B -> a: 0.29
* B -> b: 58.29
**E) Exclusion**
* **Title:** Exclusion
* **Diagram:** Network diagram with nodes 'a', 'B', and 'C'. Nodes 'a' and 'B' are enclosed in a light blue box, and the entire diagram is enclosed in a dashed gray box.
* φs(aB) = 0.17
* φs(a) = 0.06
* φs(C) = 0.29
* φs(aBC) = 0.13
### Detailed Analysis or ### Content Details
* **Network Diagrams:** Each diagram shows a network of nodes (a, B, C) with connections representing causal relationships. The connections are either black (positive) or red (negative). Self-loops indicate that a node influences its own state.
* **Transition Probability Matrices:** These matrices quantify the probabilities of transitioning between different states of the system.
* **Information Structures:** These matrices represent the cause-effect structure of the system, showing how the current state of one element influences the future state of another.
* **Partitioning:** The Integration diagram shows the effect of partitioning the system by cutting connections between elements.
* **Exclusion:** The Exclusion diagram shows the effect of considering different subsets of elements in the system.
### Key Observations
* The diagrams illustrate how IIT quantifies the amount of integrated information in a system.
* The transition probability matrices show the dynamics of the system, while the information structures show the causal relationships between elements.
* The partitioning and exclusion diagrams demonstrate how IIT identifies the most integrated and informative subset of elements in a system.
### Interpretation
The image provides a visual representation of key concepts in Integrated Information Theory (IIT). It demonstrates how IIT attempts to quantify consciousness by measuring the amount of integrated information in a system. The diagrams show how IIT analyzes the causal relationships between elements, identifies the most integrated subset of elements, and quantifies the amount of information generated by the system. The progression from Existence to Intrinsicality, Information, Integration, and Exclusion illustrates the steps involved in calculating Φ (Phi), the measure of integrated information. The data suggests that consciousness is related to the degree of integration and information generation within a system.