## Diagram: Multi-Component Information Processing Model
### Overview
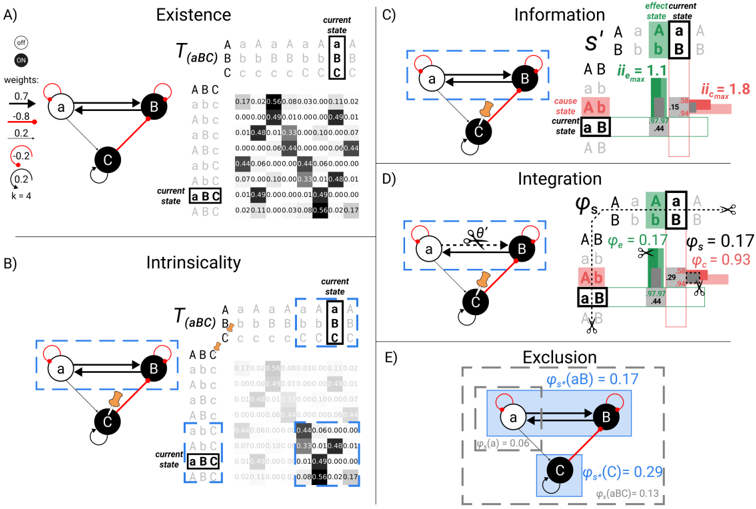
The image presents a technical diagram divided into five labeled sections (A-E), each illustrating different aspects of information processing in a networked system. Each section combines graph theory elements with matrix representations and numerical data, focusing on concepts like existence, intrinsicality, information, integration, and exclusion.
### Components/Axes
**Common Elements Across Sections:**
- **Nodes**: Labeled a, B, C (uppercase/lowercase distinction appears significant)
- **Arrows**: Colored (black, red, green) with directional flow
- **Matrices**: Labeled T(aBC) or φ_s, showing transition probabilities or information measures
- **Current State**: Highlighted in bold (e.g., "aBC" in Section A)
**Section-Specific Elements:**
- **A (Existence)**:
- Weights: 0.7 (a→B), -0.8 (B→C), 0.2 (C→a)
- Matrix T(aBC) with 3x3 grid (rows/columns: a, b, c)
- Current state: aBC (bolded)
- **B (Intrinsicality)**:
- Similar graph structure but different matrix values
- Current state: aBC (bolded)
- **C (Information)**:
- Cause-effect relationship between aB and AB
- Effect current state matrix with values like 1.1 (i_e_max), 1.8 (i_c_max)
- Legend: Green (effect), Red (cause)
- **D (Integration)**:
- φ values: φ_e=0.17, φ_s=0.17, φ_c=0.93
- Angle notation (θ') on arrow from B→C
- **E (Exclusion)**:
- φ_s values: φ_s(aB)=0.17, φ_s(C)=0.29, φ_s(aBC)=0.13
- Blue highlighted box around a and B nodes
### Detailed Analysis
**Section A (Existence):**
- Transition matrix T(aBC) shows:
- Row a: [0.17, 0.02, 0.56]
- Row b: [0.00, 0.49, 0.01]
- Row c: [0.00, 0.44, 0.00]
- Current state aBC has highest probability (0.56) for transition a→B
**Section B (Intrinsicality):**
- Matrix shows increased probabilities for self-transitions:
- Row a: [0.44, 0.00, 0.00]
- Row b: [0.00, 0.60, 0.44]
- Row c: [0.00, 0.00, 0.60]
**Section C (Information):**
- Effect current state matrix:
- AB→AB: 1.1 (i_e_max)
- AB→aB: 0.15
- AB→a: 0.44
- Cause current state shows AB→AB at 1.8 (i_c_max)
**Section D (Integration):**
- φ values indicate:
- φ_e (effect): 0.17
- φ_s (system): 0.17
- φ_c (cause): 0.93 (dominant factor)
**Section E (Exclusion):**
- φ_s values decrease with exclusion:
- φ_s(aB)=0.17
- φ_s(C)=0.29
- φ_s(aBC)=0.13 (lowest when all nodes included)
### Key Observations
1. **State Transitions**: Current state aBC consistently appears in multiple sections, suggesting it's a reference point
2. **Directional Influence**: Red arrows (negative weights) indicate inhibitory relationships
3. **Information Asymmetry**: φ_c=0.93 dominates over φ_e=0.17 in integration
4. **Exclusion Impact**: φ_s(aBC)=0.13 < φ_s(C)=0.29 suggests node exclusion reduces system integration
### Interpretation
This diagram appears to model information flow in a tripartite network (nodes a, B, C) using:
1. **Transition Matrices** (T(aBC)) to represent probabilistic state changes
2. **Information Metrics** (i_e, i_c) to quantify cause-effect relationships
3. **Integration Coefficients** (φ) to measure system coherence
4. **Exclusion Analysis** to evaluate node importance
The negative weights (-0.8) and directional arrows suggest a competitive network where nodes inhibit certain transitions. The φ_c=0.93 value indicates cause has 93% influence over system integration, while effect contributes only 17%. The exclusion analysis reveals that removing node C increases system integration (φ_s=0.29 vs 0.13), suggesting C acts as an inhibitory hub.
The uppercase/lowercase node labeling (a vs B vs C) may indicate different node types or states, with lowercase nodes potentially representing base states and uppercase representing activated states.