## Pie Chart: Distribution of Reference Answer and Test Case
### Overview
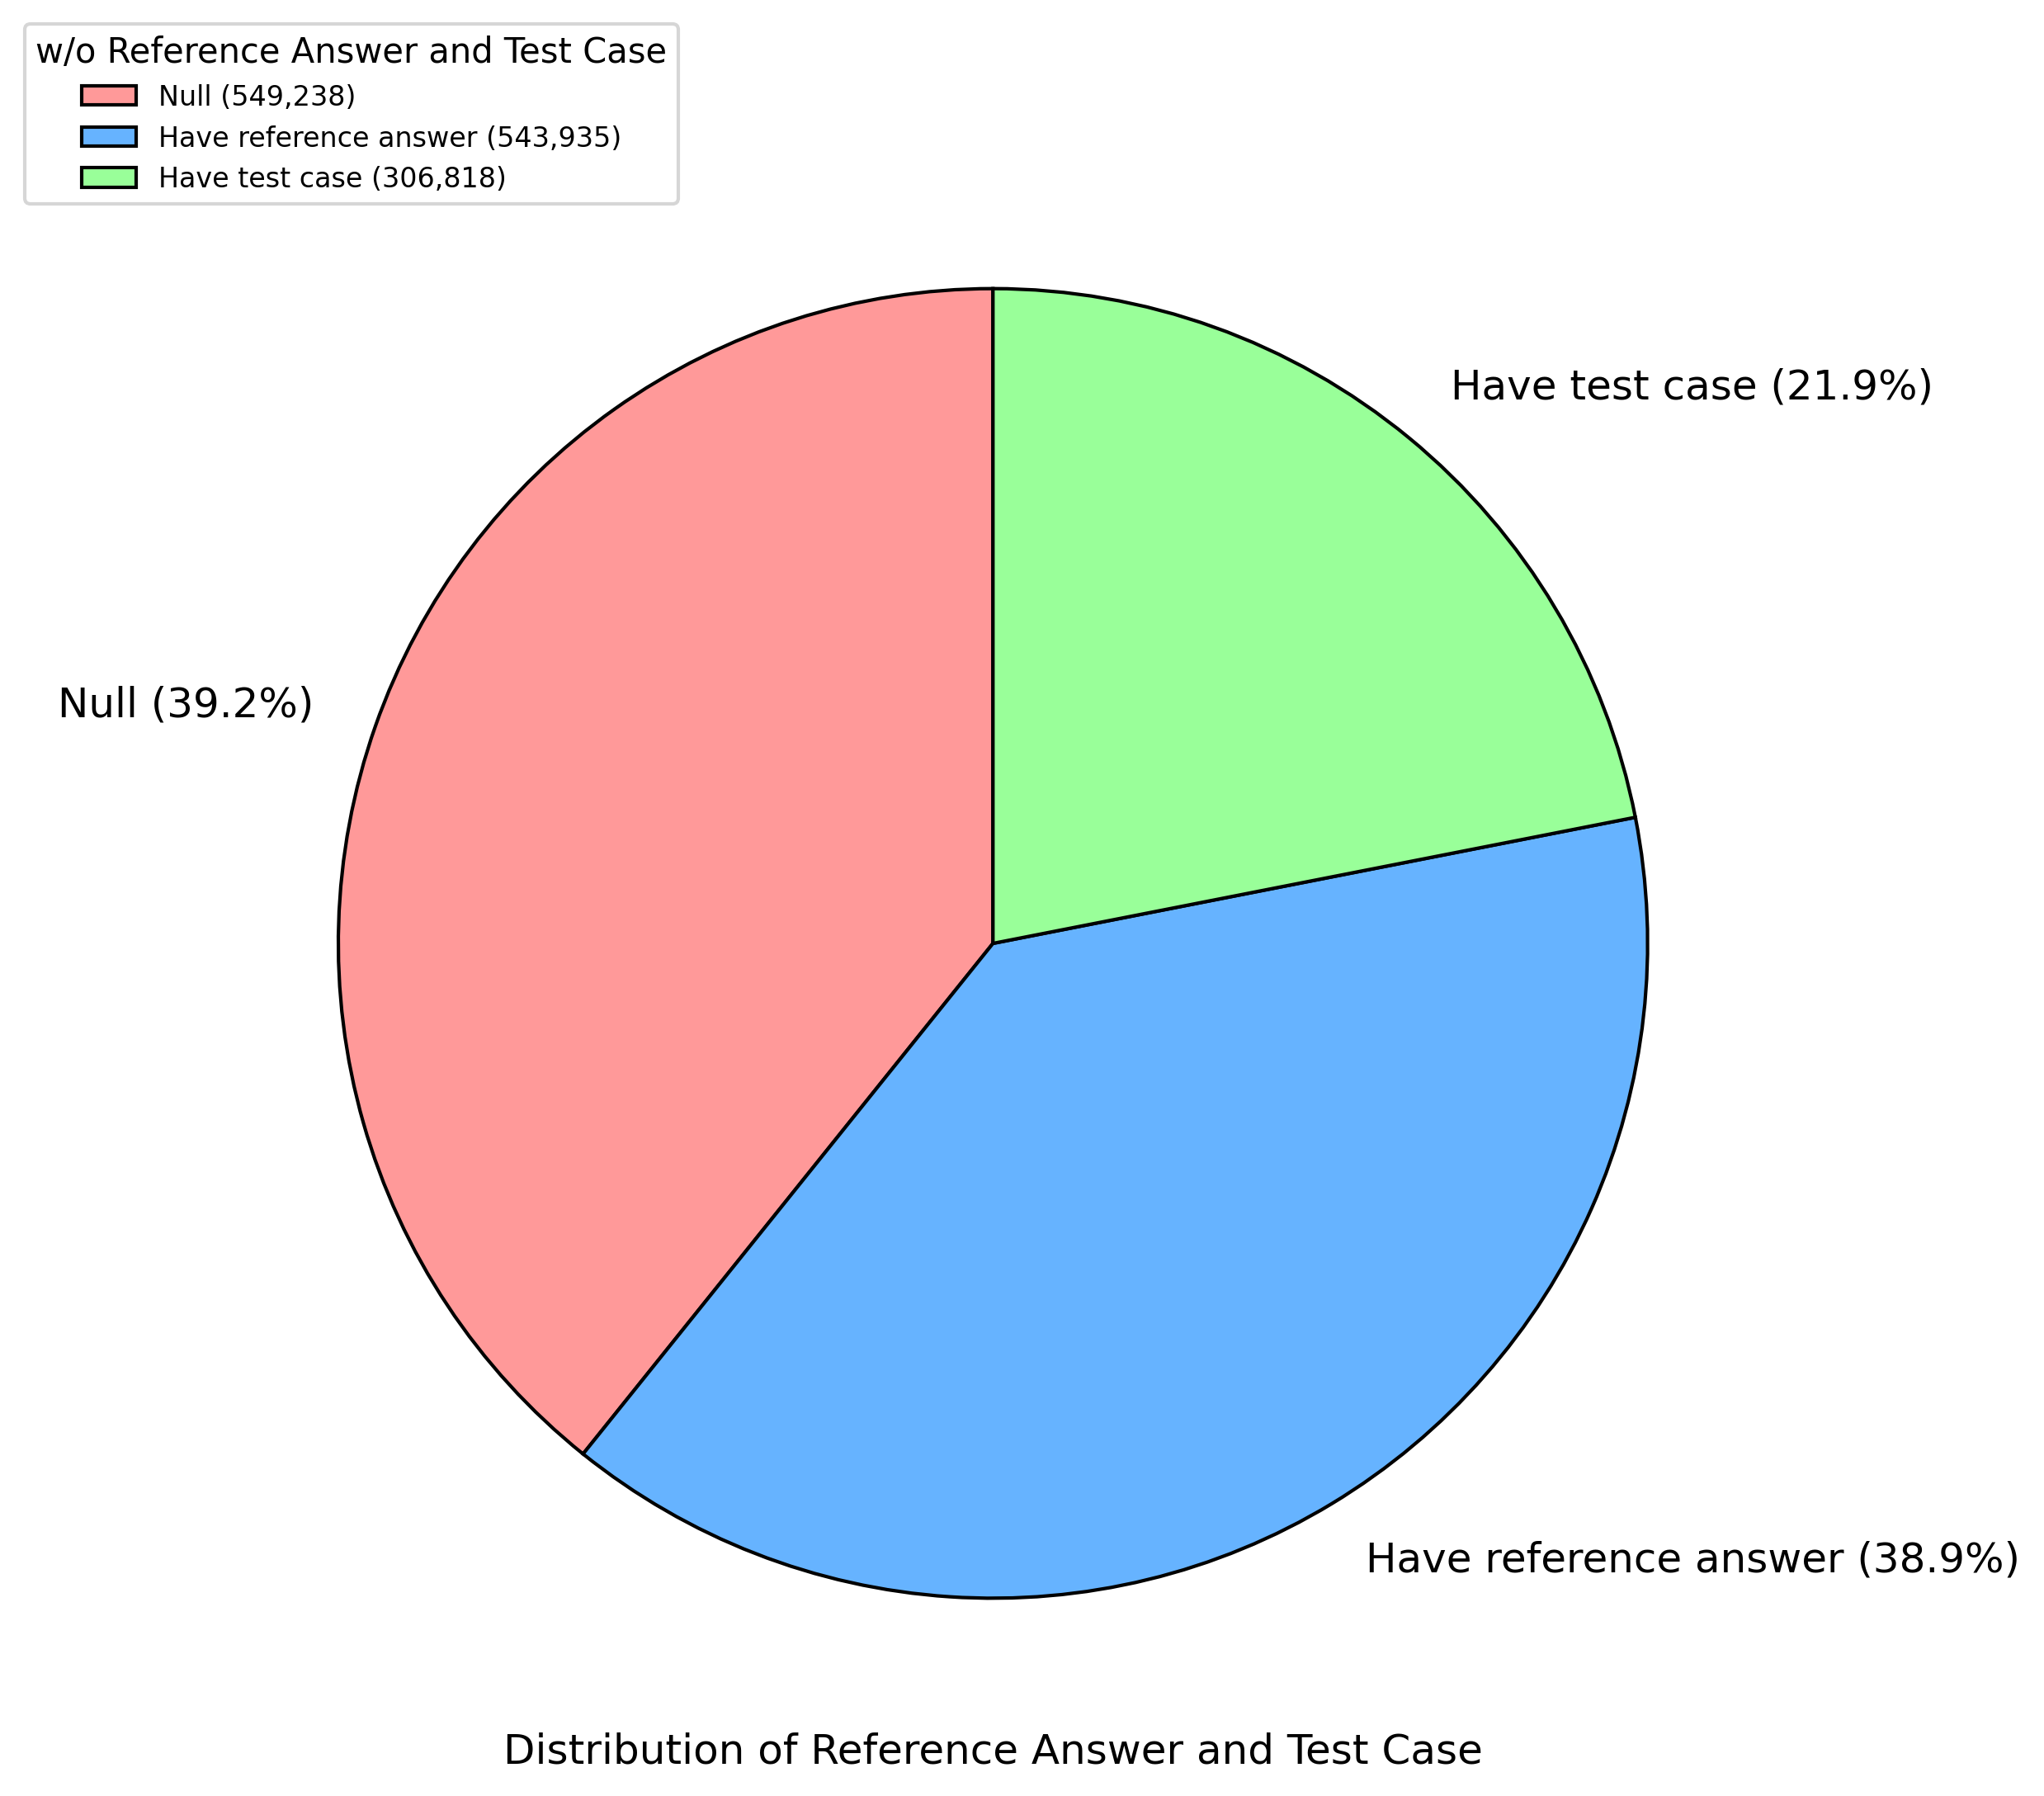
The image is a pie chart illustrating the distribution of data related to reference answers and test cases. The chart is divided into three segments, each representing a different category: "Null," "Have reference answer," and "Have test case." Each segment is labeled with its corresponding percentage and the absolute number of occurrences.
### Components/Axes
* **Title:** "w/o Reference Answer and Test Case"
* **Chart Title:** "Distribution of Reference Answer and Test Case" (located at the bottom of the chart)
* **Segments:**
* **Null:** Light red color, representing 39.2% (549,238)
* **Have reference answer:** Light blue color, representing 38.9% (543,935)
* **Have test case:** Light green color, representing 21.9% (306,818)
* **Legend:** Located in the top-left corner, matching the colors and labels of the segments.
### Detailed Analysis
* **Null:** The light red segment occupies approximately 39.2% of the pie chart, corresponding to 549,238 instances.
* **Have reference answer:** The light blue segment occupies approximately 38.9% of the pie chart, corresponding to 543,935 instances.
* **Have test case:** The light green segment occupies approximately 21.9% of the pie chart, corresponding to 306,818 instances.
### Key Observations
* The "Null" and "Have reference answer" categories have very similar percentages (39.2% and 38.9%, respectively), indicating a near-equal distribution between them.
* The "Have test case" category has a significantly smaller percentage (21.9%) compared to the other two, suggesting that test cases are less prevalent in the dataset.
### Interpretation
The pie chart provides a clear visual representation of the distribution of reference answers and test cases. The data suggests that a significant portion of the data lacks either a reference answer or a test case ("Null" category). The near-equal distribution between "Null" and "Have reference answer" indicates that having a reference answer is almost as common as having neither a reference answer nor a test case. The relatively smaller proportion of "Have test case" suggests that test cases are less frequently available compared to reference answers. This could imply a need for more comprehensive test case development or data collection efforts.