\n
## Pie Chart: Distribution of Reference Answer and Test Case
### Overview
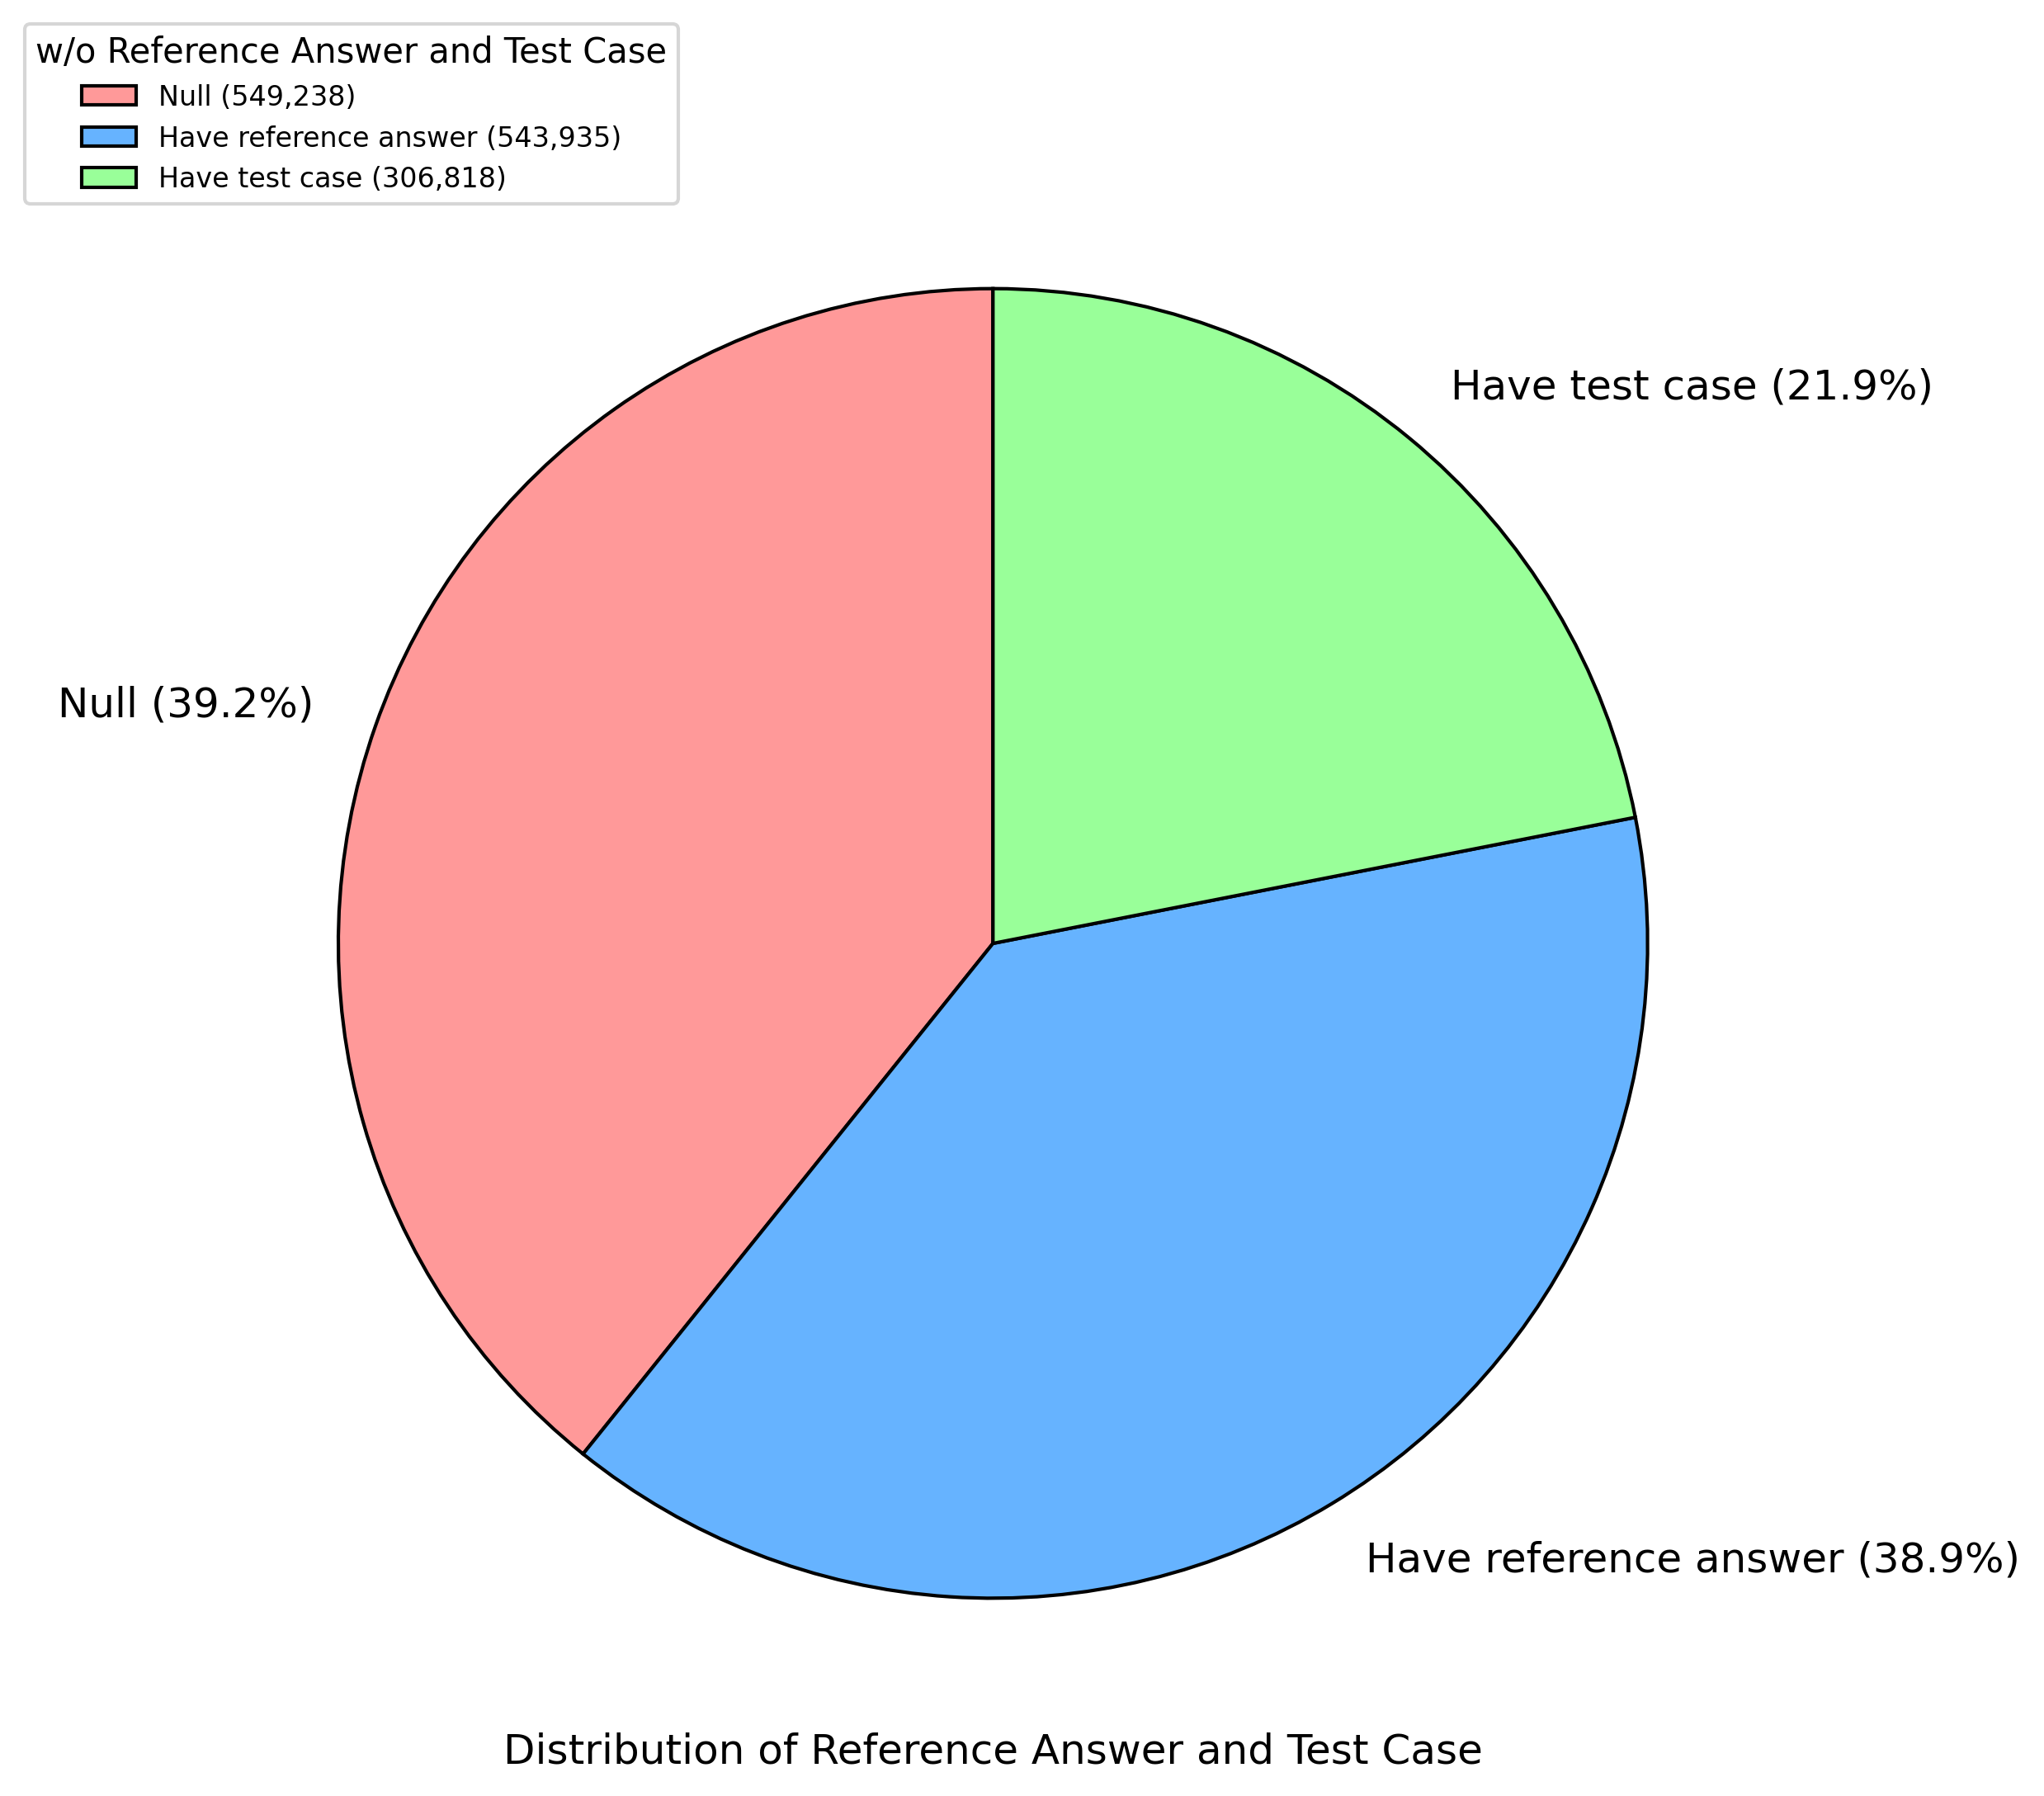
The image is a pie chart illustrating the distribution of "Reference Answer" and "Test Case" data, categorized into three groups: "Null", "Have reference answer", and "Have test case". The chart displays the percentage and numerical representation of each category.
### Components/Axes
* **Title:** "Distribution of Reference Answer and Test Case" - positioned at the bottom center of the image.
* **Legend:** Located in the top-left corner. It defines the color-coding for each category:
* Red: "Null (549,238)"
* Light Blue: "Have reference answer (543,935)"
* Light Green: "Have test case (306,818)"
* **Pie Chart Segments:** Represent the proportion of each category. Each segment is labeled with its category name and percentage.
### Detailed Analysis
The pie chart is divided into three segments.
* **Null (Red):** This segment occupies approximately 39.2% of the pie chart. The numerical value associated with this category is (549,238).
* **Have reference answer (Light Blue):** This segment occupies approximately 38.9% of the pie chart. The numerical value associated with this category is (543,935).
* **Have test case (Light Green):** This segment occupies approximately 21.9% of the pie chart. The numerical value associated with this category is (306,818).
The total number of data points represented in the chart is approximately 549,238 + 543,935 + 306,818 = 1,400,000 (rounded).
### Key Observations
* The "Null" and "Have reference answer" categories are the most dominant, each representing roughly 39% of the data.
* The "Have test case" category represents the smallest proportion of the data, at approximately 22%.
* The distribution is not uniform, with a significant portion of the data falling into the "Null" and "Have reference answer" categories.
### Interpretation
The chart suggests that a substantial portion of the dataset (approximately 78.1%) contains either missing data ("Null") or has a reference answer available ("Have reference answer"). The relatively smaller proportion of data with a test case ("Have test case") indicates that test cases are less frequently available or applicable compared to reference answers or the presence of null values. This could imply a need for more comprehensive test case generation or a focus on improving data completeness. The numerical values associated with each category provide a quantitative measure of the distribution, allowing for a more precise understanding of the data's characteristics. The chart is a visualization of the completeness of the data, and the availability of reference answers and test cases.