## Chart/Diagram Type: Multi-subplot Visualization
### Overview
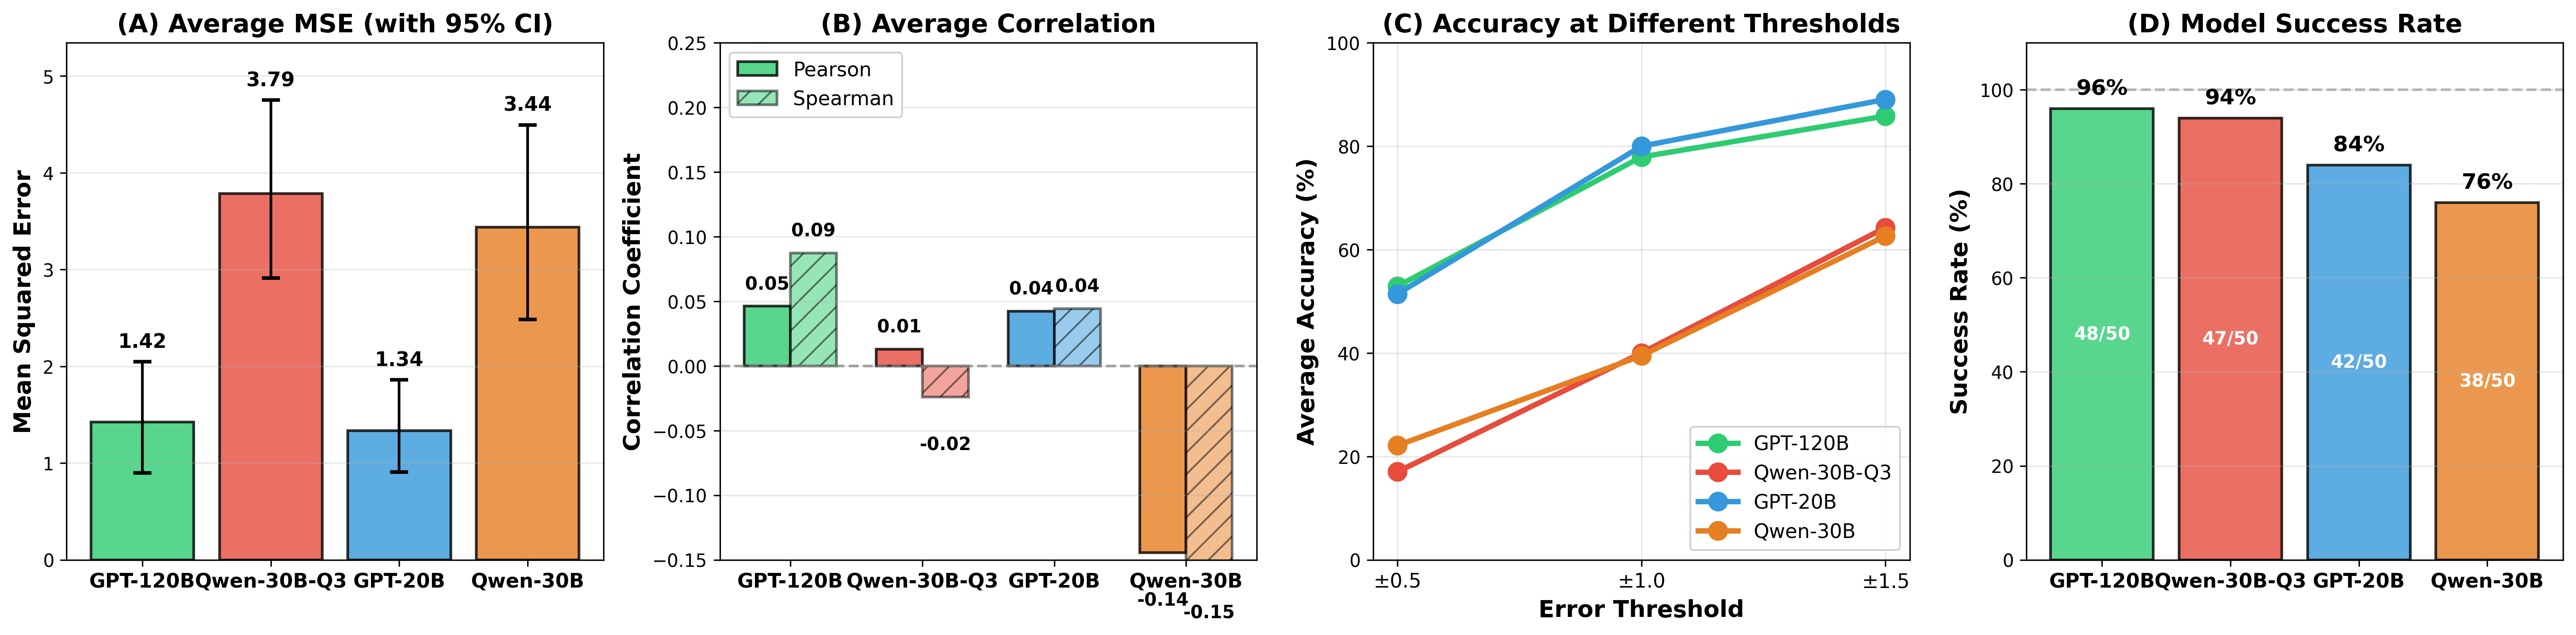
The image contains four subplots (A-D) comparing model performance metrics across four AI models: GPT-120B, Qwen-30B-Q3, GPT-20B, and Qwen-30B. Each subplot uses distinct visualizations (bar charts, line charts) and color-coded legends to represent statistical measures.
---
### Components/Axes
#### Subplot (A): Average MSE (with 95% CI)
- **Y-axis**: Mean Squared Error (0–5)
- **X-axis**: Model names (GPT-120B, Qwen-30B-Q3, GPT-20B, Qwen-30B)
- **Legend**: None (colors directly map to models)
- **Error Bars**: Vertical lines indicating 95% confidence intervals
#### Subplot (B): Average Correlation
- **Y-axis**: Correlation Coefficient (-0.15–0.25)
- **X-axis**: Model names (same as Subplot A)
- **Legend**:
- Pearson (green, striped)
- Spearman (blue, striped)
- **Error Bars**: Smaller vertical lines for confidence intervals
#### Subplot (C): Accuracy at Different Thresholds
- **X-axis**: Error Threshold (-0.5, 1.0, 1.5)
- **Y-axis**: Average Accuracy (%) (0–100)
- **Legend**:
- GPT-120B (green)
- Qwen-30B-Q3 (red)
- GPT-20B (blue)
- Qwen-30B (orange)
- **Lines**: Solid with markers at threshold points
#### Subplot (D): Model Success Rate
- **Y-axis**: Success Rate (%) (0–100)
- **X-axis**: Model names (same as Subplot A)
- **Legend**: None (colors match Subplot A)
- **Bar Labels**: Success rate percentages (e.g., 96%, 94%) and counts (e.g., 48/50)
---
### Detailed Analysis
#### Subplot (A): Average MSE
- **Values**:
- GPT-120B: 1.42 (±0.25)
- Qwen-30B-Q3: 3.79 (±0.85)
- GPT-20B: 1.34 (±0.20)
- Qwen-30B: 3.44 (±0.75)
- **Trend**: Qwen-30B-Q3 has the highest MSE, while GPT-20B has the lowest.
#### Subplot (B): Average Correlation
- **Pearson**:
- GPT-120B: 0.05 (±0.03)
- Qwen-30B-Q3: 0.01 (±0.02)
- GPT-20B: 0.04 (±0.02)
- Qwen-30B: -0.14 (±0.03)
- **Spearman**:
- GPT-120B: 0.09 (±0.04)
- Qwen-30B-Q3: -0.02 (±0.03)
- GPT-20B: 0.04 (±0.02)
- Qwen-30B: -0.15 (±0.04)
- **Trend**: Negative correlations for Qwen-30B in both metrics.
#### Subplot (C): Accuracy at Thresholds
- **Trends**:
- All models improve accuracy as error thresholds increase.
- GPT-120B and GPT-20B consistently outperform others.
- Qwen-30B-Q3 shows the steepest improvement (18% gain from -0.5 to 1.5).
#### Subplot (D): Model Success Rate
- **Values**:
- GPT-120B: 96% (48/50)
- Qwen-30B-Q3: 94% (47/50)
- GPT-20B: 84% (42/50)
- Qwen-30B: 76% (38/50)
- **Trend**: Success rates decrease from GPT-120B to Qwen-30B.
---
### Key Observations
1. **MSE vs. Success Rate**: Models with lower MSE (GPT-120B, GPT-20B) have higher success rates.
2. **Correlation Anomalies**: Qwen-30B shows negative correlations, suggesting potential inverse relationships.
3. **Accuracy Thresholds**: GPT-120B maintains >80% accuracy across all thresholds, while Qwen-30B drops below 60% at 1.5.
4. **Confidence Intervals**: Qwen-30B-Q3 has the widest error bars in MSE, indicating higher uncertainty.
---
### Interpretation
- **Model Performance**: GPT-120B and Qwen-30B-Q3 dominate in MSE, correlation, and success rate, suggesting superior robustness.
- **Negative Correlations**: Qwen-30B’s negative Spearman/Pearson values may indicate flawed metric alignment or data distribution issues.
- **Threshold Sensitivity**: GPT-120B’s consistent accuracy across thresholds implies better generalization, while Qwen-30B struggles with higher errors.
- **Success Rate Alignment**: Success rates in (D) directly correlate with MSE and correlation results, reinforcing the reliability of these metrics.
This visualization highlights trade-offs between model complexity (e.g., GPT-120B vs. Qwen-30B) and performance, with GPT-based models generally outperforming Qwen variants.