TECHNICAL ASSET FINGERPRINT
82d7ce0061746c8a81cfc186
Click to view fullscreen
Press ESC or click to close
FOUND IN PAPERS
EXPERT: gemma-3-27b-it-free VERSION 1
RUNTIME: google-free/gemma-3-27b-it
INTEL_VERIFIED
\n
## Diagram: Factors Influencing Knowledge Management
### Overview
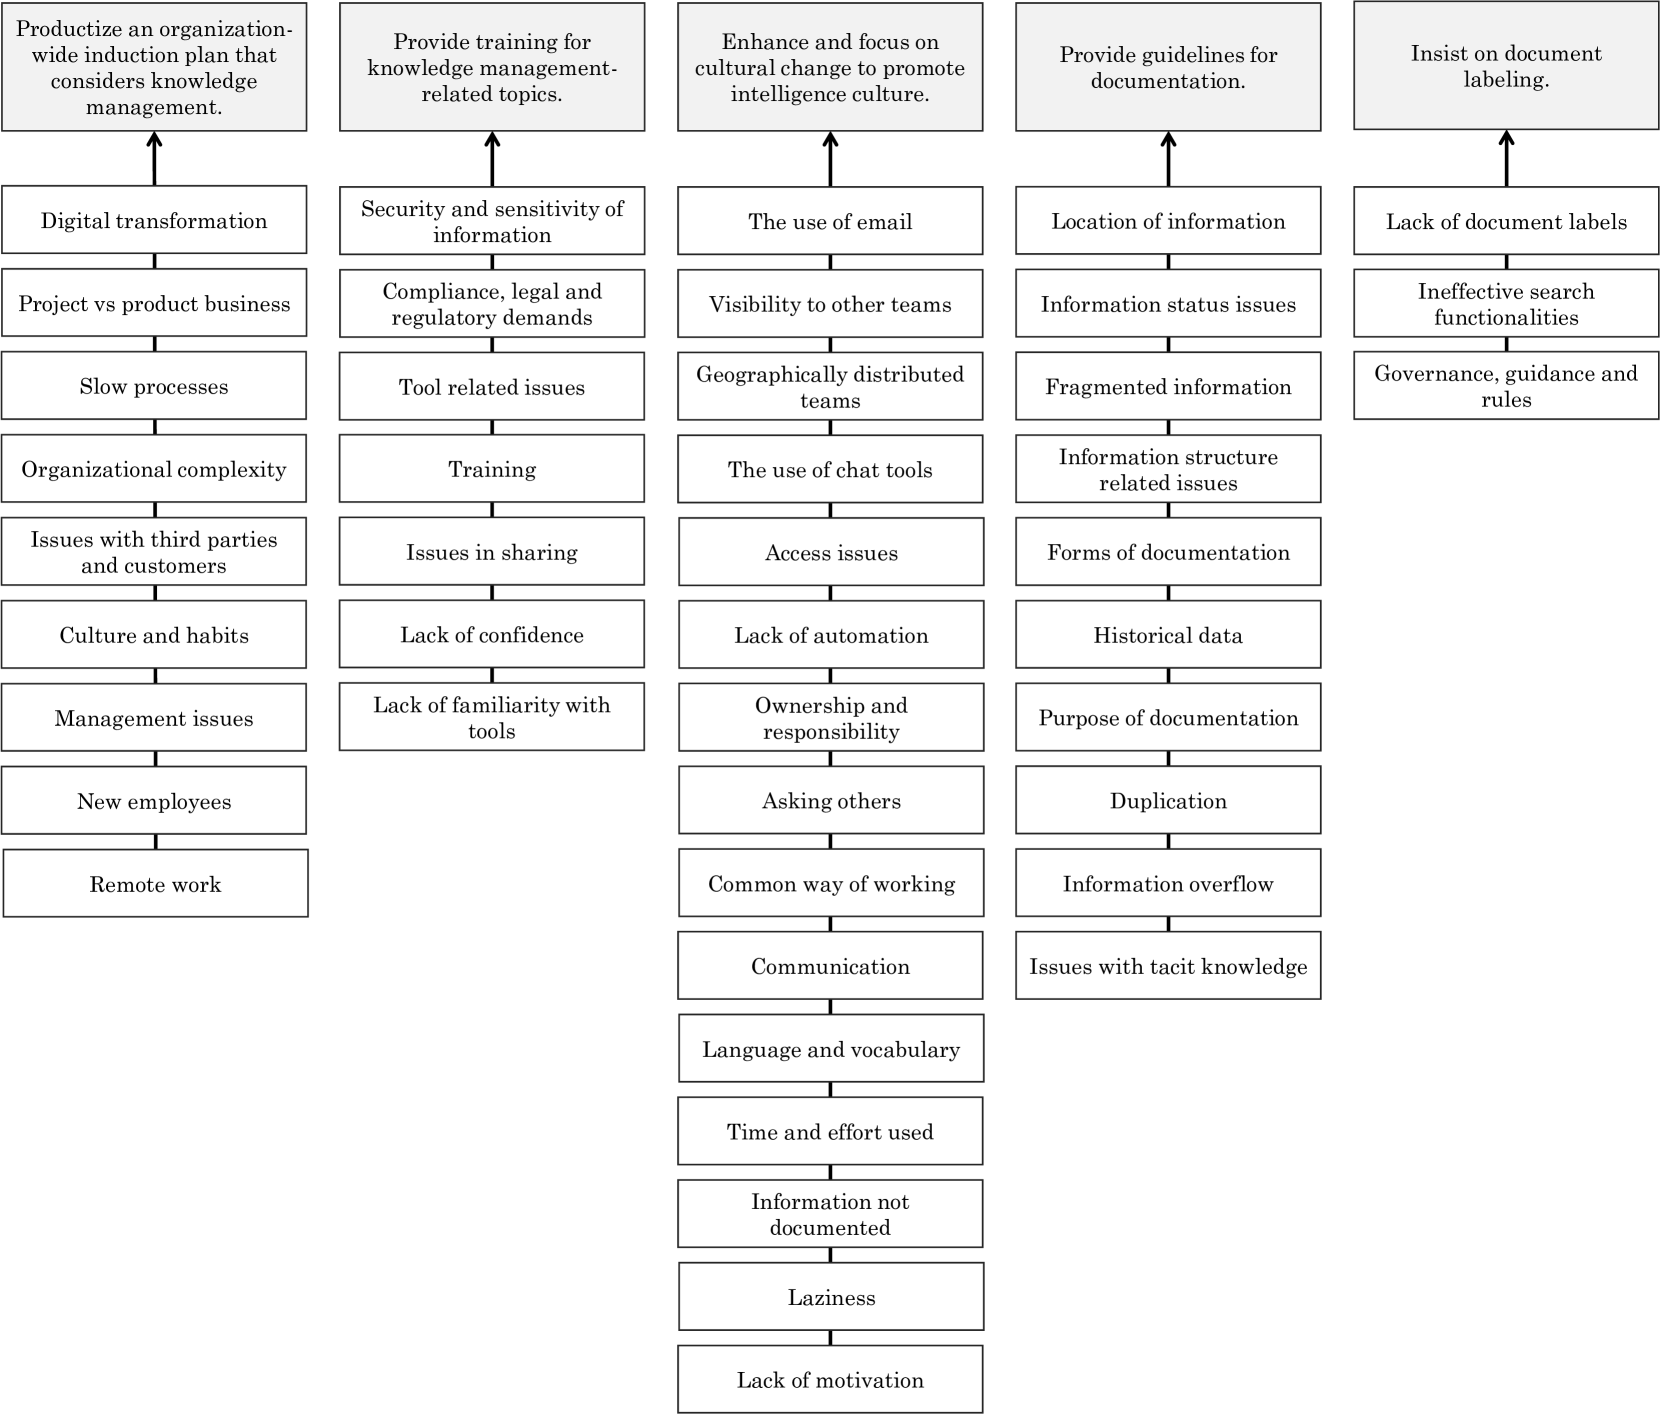
The image presents a diagram illustrating factors influencing knowledge management within an organization. It's structured as a cascading flow, starting with overarching themes at the top and branching down into increasingly specific issues. The diagram uses a series of rectangular boxes connected by arrows to show relationships and dependencies.
### Components/Axes
The diagram is organized into five main columns, each representing a broad category:
1. **Produce/train/enhance/provide/insist:** This column represents high-level actions or strategies.
2. **Security & Compliance:** This column focuses on issues related to information security, legal requirements, and compliance.
3. **Geographically Distributed Teams:** This column addresses challenges arising from remote or dispersed teams.
4. **Information Structure:** This column deals with the organization and management of information itself.
5. **Lack of…:** This column highlights deficiencies or shortcomings that hinder knowledge management.
Each column contains several boxes representing specific factors. The arrows indicate a causal or contributing relationship, flowing downwards and sometimes horizontally.
### Detailed Analysis or Content Details
**Column 1: Produce/train/enhance/provide/insist**
* **Produce** an organization-wide induction plan that considers knowledge management. (Arrow points down to "Digital transformation")
* **Provide** training for knowledge management-related topics. (Arrow points down to "Security and sensitivity of information")
* **Enhance** and focus on cultural change to promote intelligence culture. (Arrow points down to "The use of email")
* **Provide** guidelines for documentation. (Arrow points down to "Location of information")
* **Insist** on document labeling. (Arrow points down to "Lack of document labels")
**Column 2: Security & Compliance**
* Digital transformation. (Arrow points down to "Project vs product business")
* Security and sensitivity of information. (Arrow points down to "Compliance, legal and regulatory demands")
* The use of email. (Arrow points down to "Visibility to other teams")
* Location of information. (Arrow points down to "Information status issues")
* Lack of document labels. (Arrow points down to "Ineffective search functionalities")
**Column 3: Geographically Distributed Teams**
* Project vs product business. (Arrow points down to "Slow processes")
* Compliance, legal and regulatory demands. (Arrow points down to "Tool related issues")
* Visibility to other teams. (Arrow points down to "Geographically distributed teams")
* Information status issues. (Arrow points down to "Fragmented information")
* Ineffective search functionalities. (Arrow points down to "Governance, guidance and rules")
**Column 4: Information Structure**
* Slow processes. (Arrow points down to "Organizational complexity")
* Tool related issues. (Arrow points down to "Training")
* Geographically distributed teams. (Arrow points down to "The use of chat tools")
* Fragmented information. (Arrow points down to "Information structure related issues")
* Governance, guidance and rules. (Arrow points down to "Forms of documentation")
**Column 5: Lack of…**
* Organizational complexity. (Arrow points down to "Issues with third parties and customers")
* Training. (Arrow points down to "Issues in sharing")
* The use of chat tools. (Arrow points down to "Access issues")
* Information structure related issues. (Arrow points down to "Historical data")
* Forms of documentation. (Arrow points down to "Purpose of documentation")
Further down the diagram:
* Issues with third parties and customers. (Arrow points down to "Culture and habits")
* Issues in sharing. (Arrow points down to "Lack of confidence")
* Access issues. (Arrow points down to "Lack of automation")
* Historical data. (Arrow points down to "Ownership and responsibility")
* Purpose of documentation. (Arrow points down to "Duplication")
And finally:
* Culture and habits. (Arrow points down to "Management issues")
* Lack of confidence. (Arrow points down to "Lack of familiarity with tools")
* Lack of automation. (Arrow points down to "Asking others")
* Ownership and responsibility. (Arrow points down to "Common way of working")
* Duplication. (Arrow points down to "Information overflow")
The diagram concludes with:
* Management issues. (Arrow points down to "New employees")
* Lack of familiarity with tools. (Arrow points down to "Communication")
* Asking others. (Arrow points down to "Language and vocabulary")
* Common way of working. (Arrow points down to "Time and effort used")
* Information overflow. (Arrow points down to "Issues with tacit knowledge")
And the final level:
* New employees. (Arrow points down to "Remote work")
* Communication. (Arrow points down to "Information not documented")
* Language and vocabulary. (Arrow points down to "Laziness")
* Time and effort used. (Arrow points down to "Lack of motivation")
* Issues with tacit knowledge. (No arrow)
* Remote work. (No arrow)
* Information not documented. (No arrow)
* Laziness. (No arrow)
* Lack of motivation. (No arrow)
### Key Observations
The diagram highlights a complex web of interconnected factors impacting knowledge management. The cascading structure suggests that high-level strategies (Produce, Provide, Enhance, Insist) are intended to address broader issues (Security, Teams, Structure), which in turn contribute to more fundamental deficiencies (Lack of…). The final level of "Lack of…" factors suggests root causes that require attention. The diagram does not provide quantitative data, but rather a qualitative mapping of relationships.
### Interpretation
This diagram represents a systems-thinking approach to knowledge management. It acknowledges that successful knowledge management isn't simply about implementing tools or processes, but about addressing a wide range of organizational, cultural, and technological factors. The diagram suggests that a holistic strategy is needed, addressing issues at multiple levels. The emphasis on "Lack of…" factors indicates that overcoming these deficiencies is crucial for improving knowledge management. The diagram could be used as a starting point for a root cause analysis, identifying areas where interventions are most needed. The lack of arrows from the final level suggests these are terminal issues, or that addressing them would require a fundamental shift in organizational behavior. The diagram is a conceptual model, and its effectiveness would depend on the specific context of the organization.
DECODING INTELLIGENCE...