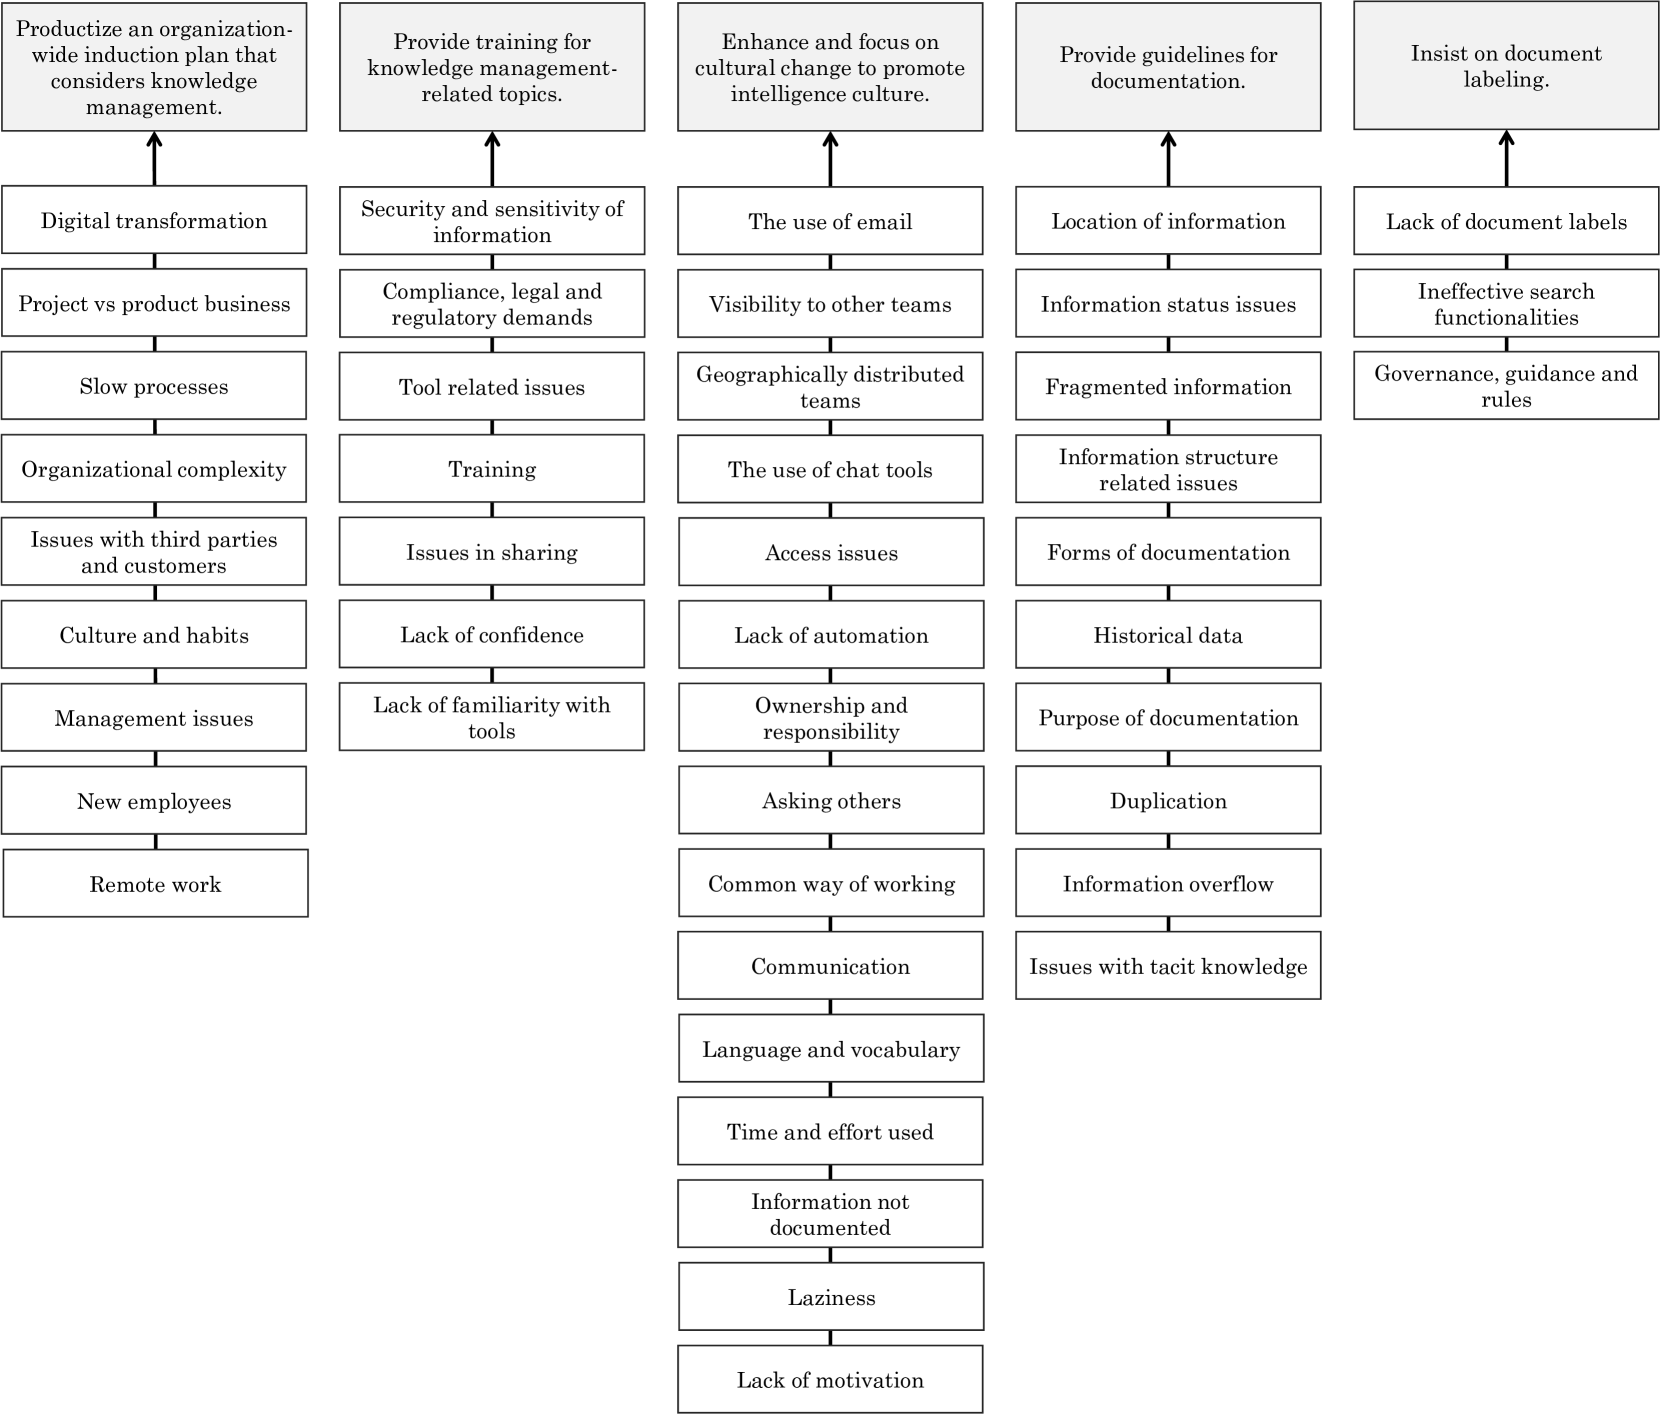
## Diagram: Knowledge Management Challenges and Strategic Responses
### Overview
The image is a structured flowchart or influence diagram presented in five vertical columns. Each column is topped by a strategic action or goal related to knowledge management. Below each top box is a vertical chain of contributing factors, challenges, or contextual elements, connected by upward-pointing arrows. The arrows indicate that the lower items are root causes, influencing factors, or issues that lead to or necessitate the strategic action at the top of the column. The diagram visually maps organizational challenges to proposed high-level solutions.
### Components/Axes
The diagram consists of five distinct vertical columns. Each column has:
1. **A Top-Level Goal Box:** A shaded rectangle at the top containing a strategic directive.
2. **A Chain of Factor Boxes:** A series of unshaded rectangles below, connected by single, upward-pointing arrows. The flow is from the bottom-most factor upward to the top goal.
3. **Spatial Layout:** The columns are arranged side-by-side from left to right. The third column is the longest, containing the most factor boxes.
### Detailed Analysis: Column-by-Column Transcription
**Column 1 (Far Left)**
* **Top Goal:** "Productize an organization-wide induction plan that considers knowledge management."
* **Factor Chain (from bottom to top):**
1. Remote work
2. New employees
3. Management issues
4. Culture and habits
5. Issues with third parties and customers
6. Organizational complexity
7. Slow processes
8. Project vs product business
9. Digital transformation
**Column 2**
* **Top Goal:** "Provide training for knowledge management-related topics."
* **Factor Chain (from bottom to top):**
1. Lack of familiarity with tools
2. Lack of confidence
3. Issues in sharing
4. Training
5. Tool related issues
6. Compliance, legal and regulatory demands
7. Security and sensitivity of information
**Column 3 (Center, Longest)**
* **Top Goal:** "Enhance and focus on cultural change to promote intelligence culture."
* **Factor Chain (from bottom to top):**
1. Lack of motivation
2. Laziness
3. Information not documented
4. Time and effort used
5. Language and vocabulary
6. Communication
7. Common way of working
8. Asking others
9. Ownership and responsibility
10. Lack of automation
11. Access issues
12. The use of chat tools
13. Geographically distributed teams
14. Visibility to other teams
15. The use of email
**Column 4**
* **Top Goal:** "Provide guidelines for documentation."
* **Factor Chain (from bottom to top):**
1. Issues with tacit knowledge
2. Information overflow
3. Duplication
4. Purpose of documentation
5. Historical data
6. Forms of documentation
7. Information structure related issues
8. Fragmented information
9. Information status issues
10. Location of information
**Column 5 (Far Right)**
* **Top Goal:** "Insist on document labeling."
* **Factor Chain (from bottom to top):**
1. Governance, guidance and rules
2. Ineffective search functionalities
3. Lack of document labels
### Key Observations
1. **Causal Structure:** The diagram explicitly frames organizational problems (lower boxes) as drivers for specific managerial interventions (top boxes). The upward arrows create a clear "problem → solution" or "issue → required action" logic.
2. **Thematic Grouping:** Each column clusters related issues. For example, Column 1 deals with broad organizational and structural challenges, Column 2 focuses on skills and compliance, Column 3 on cultural and behavioral factors, Column 4 on documentation practices, and Column 5 on information retrieval and governance.
3. **Complexity Gradient:** The central column (Column 3) is significantly longer, suggesting that cultural and behavioral change is perceived as the most complex area, influenced by the widest array of factors (15 items).
4. **Interconnectedness:** While presented in separate columns, many factors are inherently related (e.g., "Culture and habits" in Column 1 and "Lack of motivation" in Column 3). The diagram simplifies a complex web of interdependencies into discrete, manageable streams.
### Interpretation
This diagram serves as a diagnostic and planning tool for an organization aiming to improve its knowledge management (KM) practices. It moves beyond simply listing problems to prescribing strategic responses.
* **What it Demonstrates:** It argues that effective KM is not a single initiative but requires a multi-pronged strategy addressing structure (induction plans), capability (training), culture, process (documentation guidelines), and systems (labeling/search). The length of the cultural change column implies that the creators believe mindset and behavior are the most significant and multifaceted barriers.
* **Relationships Between Elements:** The structure implies that the top-level goals are *dependent* on resolving the underlying issues. For instance, you cannot successfully "Provide guidelines for documentation" without first addressing "Information overflow," "Duplication," and unclear "Purpose of documentation." The diagram advocates for a root-cause approach to KM strategy.
* **Notable Patterns:** There is a strong emphasis on human and social factors ("Culture," "Habits," "Laziness," "Lack of confidence," "Asking others") alongside technical and procedural ones. This suggests a mature understanding that KM is as much a social challenge as a technical one. The inclusion of "Remote work" and "Geographically distributed teams" highlights contemporary work model challenges.
* **Implied Investigation (Peircean):** The diagram is an *abductive* reasoning tool. It presents an observed set of organizational symptoms (the lower boxes) and proposes a set of explanatory hypotheses (the top goals) that, if acted upon, would address those symptoms. It invites the viewer to test this model against their own organizational context.