## Line Graph: Utility Value vs Batch Number
### Overview
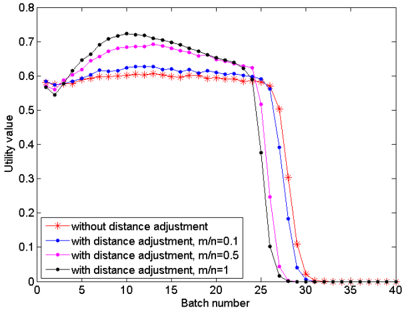
The image depicts a line graph comparing utility values across 40 batches for four scenarios: "without distance adjustment" and three configurations with distance adjustment (m/n = 0.1, 0.5, 1.0). Utility values range from 0 to 0.8, with distinct trends observed for each configuration.
### Components/Axes
- **X-axis (Batch number)**: Integers from 0 to 40, labeled "Batch number."
- **Y-axis (Utility value)**: Scale from 0 to 0.8, labeled "Utility value."
- **Legend**: Located at the bottom-left corner, with four entries:
- Red stars: "without distance adjustment"
- Blue circles: "with distance adjustment, m/n=0.1"
- Magenta diamonds: "with distance adjustment, m/n=0.5"
- Black squares: "with distance adjustment, m/n=1"
- **Line styles**: Each configuration uses a unique color and marker type.
### Detailed Analysis
1. **Without distance adjustment (red stars)**:
- Utility value remains stable (~0.55–0.6) until batch 25.
- Sharp decline to ~0.05 by batch 30, then plateaus near 0.
2. **With distance adjustment, m/n=0.1 (blue circles)**:
- Utility value starts at ~0.55, peaks at ~0.62 by batch 10.
- Gradual decline to ~0.4 by batch 25, then steep drop to ~0.05 by batch 30.
3. **With distance adjustment, m/n=0.5 (magenta diamonds)**:
- Utility value starts at ~0.58, peaks at ~0.68 by batch 10.
- Steeper decline than m/n=0.1, reaching ~0.3 by batch 25 and ~0.05 by batch 30.
4. **With distance adjustment, m/n=1 (black squares)**:
- Utility value starts at ~0.57, peaks at ~0.72 by batch 10.
- Most pronounced decline, dropping to ~0.2 by batch 25 and ~0.05 by batch 30.
### Key Observations
- **Peak utility**: All configurations with distance adjustment (m/n=0.1, 0.5, 1.0) exhibit higher initial utility values (~0.55–0.72) compared to the "without adjustment" baseline (~0.55–0.6).
- **Decline pattern**:
- The "without adjustment" line shows a delayed but abrupt collapse after batch 25.
- Configurations with higher m/n values (e.g., m/n=1) experience steeper declines post-batch 25.
- Lower m/n values (e.g., m/n=0.1) exhibit more gradual declines but still fall below the baseline by batch 30.
- **Stability**: The "without adjustment" line remains stable until batch 25, suggesting distance adjustment introduces sensitivity to batch progression.
### Interpretation
The data suggests that distance adjustment parameters (m/n) significantly impact utility value dynamics:
- **Higher m/n values** (e.g., 1.0) correlate with higher peak utility but accelerated degradation over batches.
- **Lower m/n values** (e.g., 0.1) balance peak utility and gradual decline, potentially indicating a trade-off between initial performance and long-term stability.
- The "without adjustment" baseline demonstrates resilience until batch 25, after which utility collapses, implying that distance adjustment may introduce vulnerabilities in later stages.
This pattern could reflect system optimization trade-offs, where distance adjustment improves early performance but destabilizes the system over time. Further investigation into the underlying mechanisms (e.g., parameter definitions, batch-specific stressors) is warranted to validate these hypotheses.