\n
## Line Chart: Accuracy vs. Iteration for Generation and Multiple-Choice Tasks
### Overview
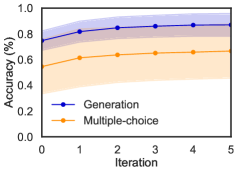
This image presents a line chart illustrating the accuracy of two tasks – "Generation" and "Multiple-choice" – over five iterations. The chart displays the mean accuracy and a shaded region representing the standard deviation or confidence interval around the mean.
### Components/Axes
* **X-axis:** "Iteration", ranging from 0 to 5.
* **Y-axis:** "Accuracy (%)", ranging from 0.0 to 1.0.
* **Data Series 1:** "Generation" – represented by a blue line with circular markers.
* **Data Series 2:** "Multiple-choice" – represented by an orange line with circular markers.
* **Legend:** Located in the bottom-left corner, associating colors with task names.
* **Shaded Regions:** Light blue and orange areas surrounding each line, indicating variability.
### Detailed Analysis
**Generation (Blue Line):**
The blue line representing "Generation" shows an upward trend, initially increasing rapidly from iteration 0 to 1, then leveling off with a slight increase from iteration 1 to 5.
* Iteration 0: Approximately 0.78 accuracy.
* Iteration 1: Approximately 0.83 accuracy.
* Iteration 2: Approximately 0.85 accuracy.
* Iteration 3: Approximately 0.86 accuracy.
* Iteration 4: Approximately 0.87 accuracy.
* Iteration 5: Approximately 0.87 accuracy.
**Multiple-choice (Orange Line):**
The orange line representing "Multiple-choice" also shows an upward trend, but it is less pronounced than the "Generation" line. The increase is more gradual and plateaus earlier.
* Iteration 0: Approximately 0.63 accuracy.
* Iteration 1: Approximately 0.67 accuracy.
* Iteration 2: Approximately 0.68 accuracy.
* Iteration 3: Approximately 0.69 accuracy.
* Iteration 4: Approximately 0.70 accuracy.
* Iteration 5: Approximately 0.70 accuracy.
The shaded regions around each line indicate the variability in accuracy. The shaded region for "Generation" is relatively consistent across iterations, while the shaded region for "Multiple-choice" appears slightly wider at lower iteration values.
### Key Observations
* "Generation" consistently outperforms "Multiple-choice" across all iterations.
* The accuracy of "Generation" increases rapidly in the initial iterations and then plateaus.
* The accuracy of "Multiple-choice" increases more slowly and also plateaus.
* The variability in accuracy appears to be slightly higher for "Multiple-choice" at the beginning of the iterations.
### Interpretation
The data suggests that the "Generation" task benefits more from iterative improvement than the "Multiple-choice" task. The initial rapid increase in accuracy for "Generation" could indicate that the model quickly learns the fundamental patterns required for the task. The subsequent plateau suggests that further iterations yield diminishing returns. The "Multiple-choice" task, being potentially simpler, reaches a performance limit more quickly. The shaded regions indicate the confidence in the accuracy measurements; wider regions suggest greater uncertainty. The consistent outperformance of "Generation" suggests that the model is more capable of complex reasoning or creative tasks compared to simple selection tasks. The chart demonstrates the impact of iterative refinement on model performance, highlighting the varying degrees of improvement achievable for different task types.